isocolors
Calculate isosurface and patch colors
Syntax
nc = isocolors(X,Y,Z,C,vertices)

nc = isocolors(X,Y,Z,R,G,B,vertices)

nc = isocolors(C,vertices)

nc = isocolors(R,G,B,vertices)

nc = isocolors(...,PatchHandle)

isocolors(...,PatchHandle)
Description
nc = isocolors(X,Y,Z,C,vertices) computes
the colors of isosurface (patch object) vertices (vertices)
using color values C. Arrays X, Y, Z define
the coordinates for the color data in C and must
be monotonic vectors that represent a Cartesian, axis-aligned grid
(as if produced by meshgrid).
The colors are returned in nc. C must
be 3-D (index colors).
nc = isocolors(X,Y,Z,R,G,B,vertices) uses R, G, B as
the red, green, and blue color arrays (true colors).
nc = isocolors(C,vertices),
and nc = isocolors(R,G,B,vertices) assume X, Y,
and Z are determined by the expression
[X Y Z] = meshgrid(1:n,1:m,1:p)
where [m n p] = size(C).
nc = isocolors(...,PatchHandle) uses
the vertices from the patch identified by PatchHandle.
isocolors(...,PatchHandle) sets
the FaceVertexCData property
of the patch specified by PatchHandle to the computed
colors.
Examples
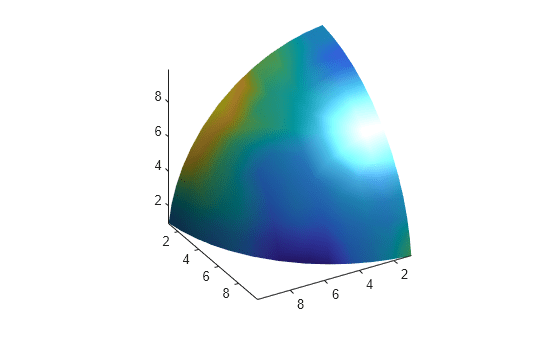
This example displays an isosurface and colors it with random data using indexed color.
[x,y,z] = meshgrid(1:20,1:20,1:20);
data = sqrt(x.^2 + y.^2 + z.^2);
cdata = smooth3(rand(size(data)),'box',7);
p = patch(isosurface(x,y,z,data,10));
isonormals(x,y,z,data,p)
isocolors(x,y,z,cdata,p)
p.FaceColor = 'interp';
p.EdgeColor = 'none';
view(150,30)
daspect([1 1 1])
axis tight
camlight
lighting gouraud
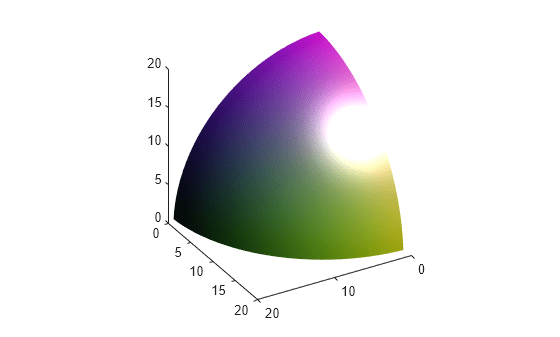
This example displays an isosurface and colors it with true color (RGB) data.
[x,y,z] = meshgrid(1:20,1:20,1:20);
data = sqrt(x.^2 + y.^2 + z.^2);
p = patch(isosurface(x,y,z,data,20));
isonormals(x,y,z,data,p)
[r,g,b] = meshgrid(20:-1:1,1:20,1:20);
isocolors(x,y,z,r/20,g/20,b/20,p)
p.FaceColor = 'interp';
p.EdgeColor = 'none';
view(150,30)
daspect([1 1 1])
camlight
lighting gouraud
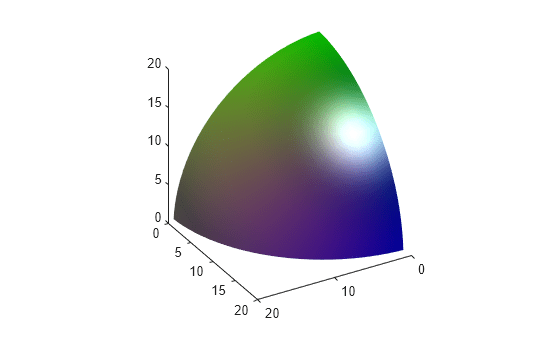
This example uses isocolors to calculate the true color data using the isosurface's (patch object's) vertices, but then returns the color data in a variable (c) in order to modify the values. It then explicitly sets the isosurface's FaceVertexCData to the new data (1-c).
[x,y,z] = meshgrid(1:20,1:20,1:20);
data = sqrt(x.^2 + y.^2 + z.^2);
p = patch(isosurface(data,20));
isonormals(data,p)
[r,g,b] = meshgrid(20:-1:1,1:20,1:20);
c = isocolors(r/20,g/20,b/20,p);
p.FaceVertexCData = 1-c;
p.FaceColor = 'interp';
p.EdgeColor = 'none';
view(150,30)
daspect([1 1 1])
camlight
lighting gouraud
Extended Capabilities
Version History
Introduced before R2006a
See Also
isosurface | subvolume | isocaps | reducepatch | smooth3 | reducevolume | isonormals