noiseCriteria
R2026bSyntax
Description
specifies options using one or more name-value arguments.NC = noiseCriteria(___,Name=Value)
[
also returns a structure containing a summary of spectrum imbalances if detected.NC,SIL,spectrumImbalance] = noiseCriteria(___)
[
also returns a structure detailing the likelihood of acoustically induced vibrations and
rattles.NC,SIL,spectrumImbalance,rattleRisk] = noiseCriteria(___)
noiseCriteria(___) without any output arguments plots the octave
band SPL measurements against NC curves and displays the NC level.
Examples
Load a recording of a room with background noise.
[audioIn, fs] = audioread("office_kitchen_44p1_20s.wav");If possible, enter the calibration factor for the microphone used to make the recording or calculate it using calibrateMicrophone. The microphone in this example has an associated reference recording at 1 kHz with an SPL meter reading of 64 dB.
[audioRef, fsRef] = audioread("1khz_64db_44p1.wav");
SPLreading = 64;
calibrationFactor = calibrateMicrophone(audioRef,fsRef,SPLreading)calibrationFactor = 2.0836
Plot the NC level for the room recording.
noiseCriteria(audioIn,fs,CalibrationFactor=calibrationFactor)
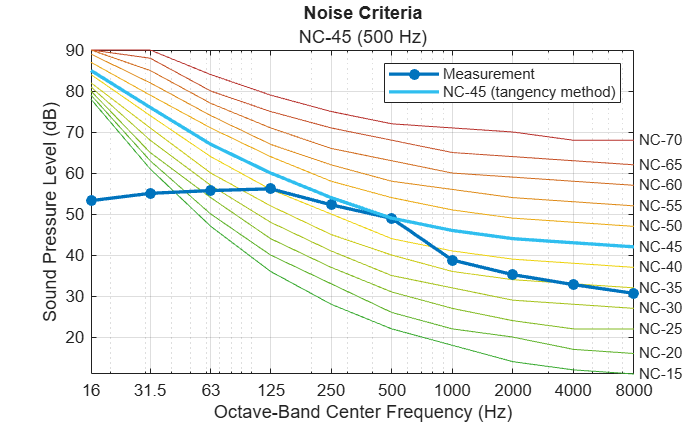
This room has an NC level of 45. Additionally calculate the SIL and analyze the room for spectrum imbalances and rattle risk.
[NC, SIL, sI, rr] = noiseCriteria(audioIn,fs,CalibrationFactor=calibrationFactor)
NC = "NC-45 (500 Hz)"
SIL = 38.9369
sI = struct with fields:
Summary: ""
Details: [5×4 table]
rr = struct with fields:
Summary: "No acoustically induced vibrations and rattles issues detected."
Details: [3×3 table]
Collect equivalent continuous sound level (Leq) measurements of a room using an SPL meter with octave band filters centered at 16, 31.5, 63, 125, 250, 500, 1000, 2000, 4000, and 8000 Hz.
Leq = [66, 46, 46, 49, 44, 46, 44, 38, 31, 19]; % readings from meterUse noiseCriteria to calculate the NC level using the readings from the SPL meter.
NC = noiseCriteria(Leq)
NC = "NC-43 (1000 Hz)"
Not all SPL meters cover the 16–8000 Hz frequency range required by the ANSI/ASA S12.2-2019 standard, so you can omit readings in the 16, 31.5, and 8000 Hz bands. The function ignores missing readings from these bands and calculates the NC level without them. You must specify all other bands.
LeqNarrow = Leq; LeqNarrow([1:2,10]) = missing; NC = noiseCriteria(LeqNarrow)
NC = "NC-43 (1000 Hz)"
Omitting readings from the 16, 31.5, and 8000 Hz octave bands rarely results in a significantly different NC designation. However, the rattle risk may be inaccurate with missing bands.
[~,~,~,rr] = noiseCriteria(Leq)
rr = struct with fields:
Summary: "Moderately perceptible at 16 Hz (66 dB > 65 dB threshold)"
Details: [3×3 table]
[~,~,~,rrLimited] = noiseCriteria(LeqNarrow)
rrLimited = struct with fields:
Summary: "No acoustically induced vibrations and rattles issues detected."
Details: [3×3 table]
Input Arguments
Audio input, specified as a column vector of real finite numbers. If
audioIn is not calibrated, you can determine the calibration
factor using calibrateMicrophone. Specify the first argument as either
audioIn or Leq.
For guidance on taking compliant measurements, see Calibration Factor for Audio Recordings.
Data Types: single | double
Octave-band equivalent continuous sound level (Leq) measurements in decibels (dB), specified as a 10-element row vector. Each element must correspond to a measurement at nominal octave band center 16, 31.5, 63, 125, 250, 500, 1000, 2000, 4000, and 8000 Hz, respectively.
If the SPL for a given band is unknown, specify it as missing. An
NC level calculated with missing Leq values
might not be compliant with ASA S12.2-2019.
Specify either audioIn or
Leq.
For guidance on taking compliant measurements, see Obtaining Standard-Compliant Sound Level Measurements.
Data Types: single | double
Name-Value Arguments
Specify optional pairs of arguments as
Name1=Value1,...,NameN=ValueN, where Name is
the argument name and Value is the corresponding value.
Name-value arguments must appear after other arguments, but the order of the
pairs does not matter.
Example: noiseCriteria(audioIn,fs,CalibrationFactor=1.5)
Microphone calibration factor, specified as a positive scalar.
audioIn is multiplied by CalibrationFactor
before analysis. To compute the calibration factor specific to your system, use the
calibrateMicrophone function.
CalibrationFactor is valid only when you specify the first
argument as audioIn.
Data Types: single | double
Reference pressure for dB calculation in pascals, specified as a positive scalar. The default value, 20 micropascals, is the common value for air.
PressureReference is valid only when you specify the first
argument as audioIn.
Data Types: single | double
Option to screen audio input for surging, specified as true or
false. If you set ScreenSurging to
true, noiseCriteria uses a nonstandard
heuristic to detect whether surging is present.
For more information on surging and the heuristic, see Screening for Surging.
ScreenSurging is valid only when you specify the first
argument as audioIn.
Data Types: logical
Option to screen audio input for large random fluctuations, specified as
true or false. If you set
ScreenLargeRandomFluctuations to true,
noiseCriteria follows screening criteria from ASA S12.2-2019 to
determine if large random fluctuations are present.
For more information on screening for large random fluctuations, see Screening for Large Random Fluctuations.
ScreenLargeRandomFluctuations is valid only when you specify
the first argument as audioIn.
Data Types: logical
Output Arguments
NC level, returned as a string. When the function selects the NC curve using the
SIL, NC has the format NC-SIL. When it selects the curve using the
tangency method, NC has the form NC-CurveID (TC), where CurveID is
the NC curve tangent to the SPL measurements and TC is the tangency frequency in
Hz.
For more information on the NC tangency method, see NC Tangency Method.
Example: "NC-51 (125 Hz)" indicates an NC level of 51 using the NC
tangency method, where the SPL in the octave band centered at 125 Hz was closest to the
NC-51 curve.
Example: "NC-25" indicates an NC level of 25 using the
SIL.
Speech interference level, returned as a scalar. The speech interference level is
the average of the SPL measurements in the 500, 1000, 2000, and 4000 Hz octave bands.
You can also compute SIL using the speechInterferenceLevel function.
For more information, see Speech Interference Level.
Spectrum imbalance, returned as a structure or character vector. When the function
determines the NC level to be between NC-15 and NC-70,
spectrumImbalance contains a summary of spectrum imbalance issues
that might cause dissatisfaction for occupants in the room and the table of values used
to determine the summary. When the NC level is lower than NC-15 or above NC-70,
spectrumImbalance is a character vector stating that the standard
does not define spectrum imbalance for the determined NC level.
For more information on spectrum imbalance determination, see Spectrum Imbalance.
Risk of acoustically induced vibrations and rattles, returned as a structure.
rattleRisk contains a summary of octave bands that can contain
perceptible rattle and the table of values used by the function to determine the
risk.
For more information on rattle risk, see Rattle Risk.
More About
Calibrating the input before calling
noiseCriteria
using an audio file is recommended for more accurate results. Record a 1 kHz tone
using the reference microphone and note the SPL reading from a compliant SPL meter. Use the
calibrateMicrophone function to obtain the calibration factor.
The diagram shows a typical setup for microphone calibration. For room noise evaluation, use Z frequency-weighting (some meters use the label linear or flat).
The ANSI/ASA S12.2-2019 [1] standard provides the following guidance for collecting an accurate audio recording and SPL measurements collected in indoor spaces:
Measure near the average standing or seating height for the expected room occupants.
The microphone or meter must be at least 0.6 m from any acoustically reflective surface, 1.2 m from the intersection of any two surfaces, and 2.4 m from the intersection of any three surfaces.
Record Leq measurements using a standard-compliant integrating-averaging meter set to fast time weighting and flat (Z-weighted) frequency weighting. For more information, see
splMeter.Take measurements at a specific point of interest or using a slow sweep around the entire space.
Record audio or measurements for at least 20 seconds when sweeping around the space.
The speech interference level (SIL) is the average of the SPL measurements in the 500, 1000, 2000, and 4000 Hz octave bands, calculated as
where LX is the SPL measured at the octave
band centered at nominal frequency X Hz. This definition is consistent
with SIL as defined in the ANSI/ASA S12.65-2006 standard [2]. You can also calculate
SIL using the speechInterferenceLevel function, which also
reports SIL over time.
NC curves [1] are used to evaluate background noise in buildings and to specify desired sound levels for indoor spaces during architectural planning and design. The curves are primarily shaped according to speech intelligibility, determined by the SPL in the 500–4000 Hz octave bands.
An initial NC curve is determined as NC-SIL, where SIL is calculated using the input audio recording or SPL measurements. If the SPL in any octave band exceeds the corresponding level in the NC curve, the NC level is chosen as the highest NC curve that intersects with the SPL measurements. This procedure is called the tangency method, and the octave band that intersects the curve is the tangency frequency.
Excessive noise levels at low frequencies often require remediation in settings such as offices and meeting spaces. The standard [1] defines the following method for determining if a spectrum imbalance is likely to cause dissatisfaction for occupants:
Calculate the SIL.
Select the NC curve associated with the calculated SIL.
Calculate the difference between the measured SPL in the 63, 125, and 250 Hz octave bands and the corresponding SPL values in the selected NC curve.
For any of the three analyzed octave bands, serious dissatisfaction is possible if the measured SPL exceeds the NC curve by 6–9 dB, and likely if the measured SPL exceeds the NC curve by more than 9 dB.
According to the ANSI/ASA S12.2-2019 [1] standard, if Leq measurements in the low-frequency octave bands exceed the values in the table, acoustically induced vibrations and rattles are likely.
| Octave Band | 16 Hz | 31.5 Hz | 63 Hz |
|---|---|---|---|
| Clearly perceptible vibration and rattles likely | 75 dB | 75 dB | 80 dB |
| Moderately perceptible vibration and rattles likely | 65 dB | 65 dB | 70 dB |
ANSI/ASA S12.2-2019 [1] recommends aural or visual inspection of SPL measurements to determine if surging is present. Surging is primarily observed as periodic fluctuations in the 16, 31.5, and 63 Hz octave bands. When screening for surging, set the SPL meter to fast time-weighting and flat (Z-weighted) frequency weighting, with measurements reported every 100 ms.
Because ANSI/ASA S12.2-2019 does not define a method to determine if surging is present,
the noiseCriteria function implements a heuristic method. SPL
measurements in the 16, 31.5, and 63 Hz octave bands are collected using the SPL meter
settings. Autocorrelation is calculated on the measurements for each band. If a significant
peak is found in the lag domain of any band corresponding to a modulation frequency less
than or equal to 4 Hz, surging is detected. For more information, see xcorr.
The standard recommends using the room noise criteria (RNC) instead of NC if surging is
present. By default, noiseCriteria screens audio inputs for surging and
raises a warning to use roomNoiseCriteria if surging is detected. Because the detection is
nonstandard, use this warning with caution. You can disable screening by setting ScreenSurging to
false.
Large random fluctuations are detected using the method defined in the ANSI/ASA S12.2-2019 [1] standard. The Leq measurements of the lowest three octave bands are combined as
where LX is the SPL measured at the octave band centered at nominal frequency X Hz.
Fluctuations are detected using the Leq, the maximum observed level (LMAX), and the 90th percentile level (L10) from Lc and L125. If the differences exceed the values in the following table, large random fluctuations are present.
| Octave band | Lc | L125 |
|---|---|---|
| LMAX minus Leq | ≥ 7 dB | ≥ 6 dB |
| L10 minus Leq | ≥ 3.5 dB | ≥ 3 dB |
The standard recommends using RNC instead of NC if large random fluctuations are
present. By default, noiseCriteria screens audio inputs and raises a
warning to use roomNoiseCriteria if large random fluctuations are detected. You can disable
screening by setting ScreenLargeRandomFluctuations to false.
References
[1] Acoustical Society of America. Criteria for Evaluating Room Noise. ANSI/ASA S12.2-2019 (R2023). Acoustical Society of America, 2019.
[2] Acoustical Society of America. American National Standard for Rating Noise with Respect to Speech Interference (R2011). ANSI/ASA S12.65-2006. Acoustical Society of America, 2011.
Version History
Introduced in R2026b
MATLAB Command
You clicked a link that corresponds to this MATLAB command:
Run the command by entering it in the MATLAB Command Window. Web browsers do not support MATLAB commands.
Select a Web Site
Choose a web site to get translated content where available and see local events and offers. Based on your location, we recommend that you select: .
You can also select a web site from the following list
How to Get Best Site Performance
Select the China site (in Chinese or English) for best site performance. Other MathWorks country sites are not optimized for visits from your location.
Americas
- América Latina (Español)
- Canada (English)
- United States (English)
Europe
- Belgium (English)
- Denmark (English)
- Deutschland (Deutsch)
- España (Español)
- Finland (English)
- France (Français)
- Ireland (English)
- Italia (Italiano)
- Luxembourg (English)
- Netherlands (English)
- Norway (English)
- Österreich (Deutsch)
- Portugal (English)
- Sweden (English)
- Switzerland
- United Kingdom (English)