comm.PhaseFrequencyOffset
Apply phase and frequency offsets to input signal
Description
The comm.PhaseFrequencyOffset
System object™ applies phase and frequency offsets to an input signal.
To apply phase and frequency offsets to an input signal:
Create the
comm.PhaseFrequencyOffsetobject and set its properties.Call the object with arguments, as if it were a function.
To learn more about how System objects work, see What Are System Objects?
Creation
Description
pfo = comm.PhaseFrequencyOffset
pfo = comm.PhaseFrequencyOffset(Name=Value)comm.PhaseFrequencyOffset(SampleRate=20) creates a phase
and frequency offset object and sets a sample rate of 20 Hz. You can specify
additional name-value pair arguments in any order as
(Name1=Value1,...,NameN=ValueN).
Properties
Usage
Description
Y = pfo(X)FrequencyOffsetSource to "Property".
Y = pfo(X,fOffset)X. To use this
syntax, set the FrequencyOffsetSource to "Input port".
Input Arguments
Output Arguments
Object Functions
To use an object function, specify the
System object as the first input argument. For
example, to release system resources of a System object named obj, use
this syntax:
release(obj)
Examples
Introduce a phase offset to a 16-QAM signal and view its effect on the constellation.
Create a phase frequency offset System object™, setting the phase offset to 30 degrees.
pfo = comm.PhaseFrequencyOffset(PhaseOffset=30);
Generate random symbols and apply 16-QAM modulation.
M = 16;
data = (0:M-1)';
x = qammod(data,M);
Plot the 16-QAM constellation.
scatterplot(x);
title("Original Constellation")
xlim([-5 5])
ylim([-5 5])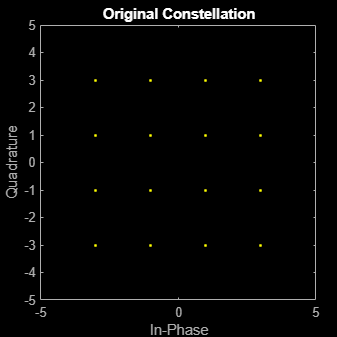
Introduce a phase offset and plot the offset constellation.
y = pfo(x);
scatterplot(y);
title("Constellation After Phase Offset")
xlim([-5 5])
ylim([-5 5])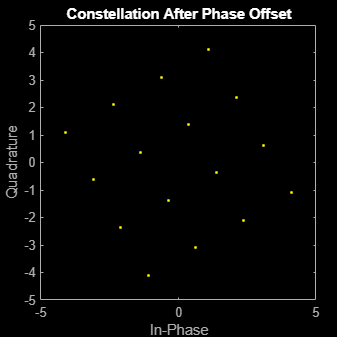
More About
Algorithms
If the input signal is u(t), then the output signal is
where f(t) is the frequency offset, and φ(t) is the phase offset.
The discrete-time output is given by
where i > 0, and Δt is the sample time.