Main Content

distributionScores

R2026b

Distribution confidence scores

Since R2023a

    Description

    Add-On Required: This feature requires the AI Verification Library for Deep Learning Toolbox add-on.

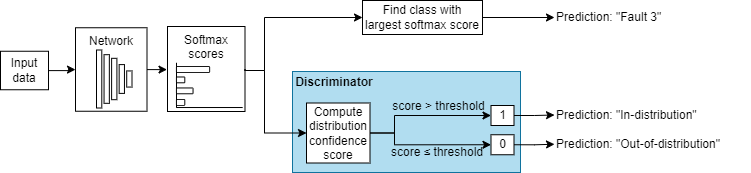
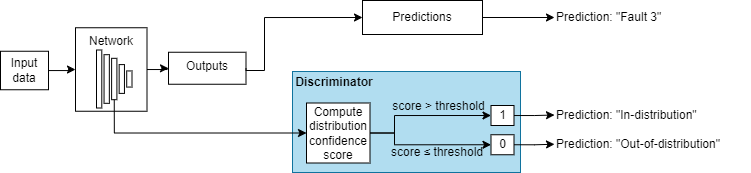
    scores = distributionScores(discriminator,X) returns the distribution confidence score for each observation in X using the method you specify in the Method property of discriminator. You can use the scores to separate data into in-distribution (ID) and out-of-distribution (OOD) data sets. For example, you can classify any observation with distribution confidence score less than or equal to the Threshold property of discriminator as OOD. For more information about how the software computes the distribution confidence scores, see Distribution Confidence Scores.

    example

    scores = distributionScores(discriminator,X1,...,XN) returns the distribution scores for networks with multiple inputs using the specified in-memory data.

    scores = distributionScores(___,Name=Value) also specifies the verbosity level.

    Examples

    collapse all

    Load a pretrained classification network.

    load('digitsClassificationMLPNetwork.mat');

    Load ID data.

    XID = digitTrain4DArrayData;

    Modify the ID training data to create an OOD set.

    XOOD = XID.*0.3 + 0.1;

    Create a discriminator using the networkDistributionDiscriminator function.

    method = "baseline";
    discriminator = networkDistributionDiscriminator(net,XID,XOOD,method)
    discriminator = 
      BaselineDistributionDiscriminator with properties:
    
           Method: "baseline"
          Network: [1×1 dlnetwork]
        Threshold: 0.9743


    The discriminator object contains a threshold for separating the ID and OOD confidence scores.

    Use the distributionScores function to find the distribution scores for the ID and OOD data. You can use the distribution confidence scores to separate the data into ID and OOD. The algorithm the software uses to compute the scores is set when you create the discriminator. In this example, the software computes the scores using the baseline method.

    scoresID = distributionScores(discriminator,XID);
    scoresOOD = distributionScores(discriminator,XOOD);

    Plot the distribution confidence scores for the ID and OOD data. Add the threshold separating the ID and OOD confidence scores.

    figure
    histogram(scoresID,BinWidth=0.02)
    hold on
    histogram(scoresOOD,BinWidth=0.02)
    xline(discriminator.Threshold)
    legend(["In-distribution scores","Out-of-distribution scores","Threshold"],Location="northwest")
    xlabel("Distribution Confidence Scores")
    ylabel("Frequency")
    hold off
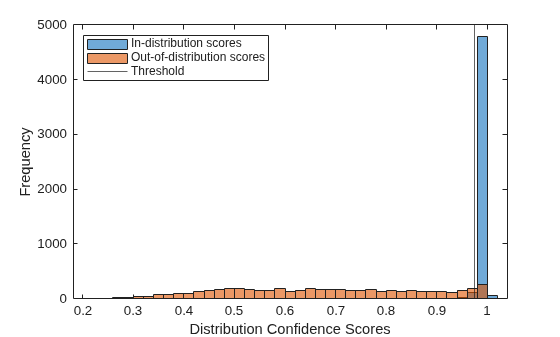
    Figure contains an axes object. The axes object with xlabel Distribution Confidence Scores, ylabel Frequency contains 3 objects of type histogram, constantline. These objects represent In-distribution scores, Out-of-distribution scores, Threshold.

    Load a pretrained classification network.

    load("digitsClassificationMLPNetwork.mat");

    Load ID data.

    XID = digitTrain4DArrayData;

    Modify the ID training data to create an OOD set.

    XOOD = XID.*0.3 + 0.1;

    Create a discriminator.

    method = "baseline";
    discriminator = networkDistributionDiscriminator(net,XID,XOOD,method);

    Use the distributionScores function to find the distribution scores for the ID and OOD data. You can use the distribution scores to separate the data into ID and OOD.

    scoresID = distributionScores(discriminator,XID);
    scoresOOD = distributionScores(discriminator,XOOD);

    Use rocmetrics to plot a ROC curve to show how well the model performs at separating the data into ID and OOD.

    labels = [
        repelem("In-distribution",numel(scoresID)), ...
        repelem("Out-of-distribution",numel(scoresOOD))];
    scores = [scoresID',scoresOOD'];
    
    rocObj = rocmetrics(labels,gather(scores),"In-distribution");
    figure
    plot(rocObj)
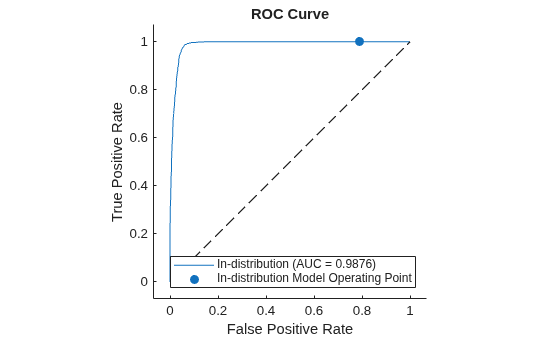
    Figure contains an axes object. The axes object with title ROC Curve, xlabel False Positive Rate, ylabel True Positive Rate contains 3 objects of type roccurve, scatter, line. These objects represent In-distribution (AUC = 0.9876), In-distribution Model Operating Point.

    Input Arguments

    collapse all

    Input data, specified as a formatted or unformatted dlarray object, minibatchqueue, numeric array, categorical array, datastore, cell array, or table.

    If you specify a minibatchqueue object, the PreprocessingEnvironment property must be "serial" (default).

    Use a minibatchqueue or datastore object for a network with multiple inputs where the data does not fit in memory. If you have data that fits in memory that does not require additional processing, then it is usually easiest to specify the input data as in-memory arrays. For more information, see X1,...,XN.

    Before R2026b: If you specify the input as a minibatchqueue object, then it must return an formatted dlarray

    In-memory data for multi-input network, specified as formatted or unformatted dlarray objects, numeric arrays, categorical arrays, cell arrays, or tables. The input Xi corresponds to the network input discriminator.Network.InputNames(i).

    For multi-input networks, if you have data that fits in memory that does not require additional processing, then it is usually easiest to specify the input data as in-memory arrays. If you want to make predictions with data stored on disk, then specify X as a minibatchqueue object.

    Name-Value Arguments

    collapse all

    Specify optional pairs of arguments as Name1=Value1,...,NameN=ValueN, where Name is the argument name and Value is the corresponding value. Name-value arguments must appear after other arguments, but the order of the pairs does not matter.

    Example: Verbosity

    Verbosity level of the Command Window output, specified as one of these values:

    • "off" — Do not display progress information.

    • "summary" — Display a summary of the progress information.

    • "detailed" — Display detailed information about the progress. This option prints the mini-batch progress.

    Since R2026b

    Size of mini-batches to use for prediction, specified as a positive integer. Larger mini-batch sizes require more memory, but can lead to faster predictions.

    To specify padding options, use the SequenceLength name-value argument.

    Note

    If you specify the input data as a minibatchqueue object, then the distributionScores function uses the mini-batch size specified by this argument and not the MiniBatchSize property of the minibatchqueue object. (since R2026b)

    Data Types: single | double | int8 | int16 | int32 | int64 | uint8 | uint16 | uint32 | uint64

    Since R2026b

    Hardware resource, specified as one of these values:

    • "auto" — Use a GPU if one is available. Otherwise, use the CPU.

    • "gpu" — Use the GPU. Using a GPU requires a Parallel Computing Toolbox™ license and a supported GPU device. For information about supported devices, see GPU Computing Requirements (Parallel Computing Toolbox). If Parallel Computing Toolbox or a suitable GPU is not available, then the software returns an error.

    • "cpu" — Use the CPU.

    Before R2026b: The function uses a CPU.

    Since R2026b

    Option to pad or truncate input sequences, specified as one of these values:

    • "longest" — Pad sequences in each mini-batch to have the same length as the longest sequence. This option does not discard any data, though padding can introduce noise to the neural network.

    • "shortest" — Truncate sequences in each mini-batch to have the same length as the shortest sequence. This option ensures that no padding is added, at the cost of discarding data.

    To learn more about the effect of padding and truncating sequences, see Sequence Padding and Truncation.

    Since R2026b

    Direction of padding or truncation, specified as one of these options:

    • "right" — Pad or truncate sequences on the right. The sequences start at the same time step and the software truncates or adds padding to the end of each sequence.

    • "left" — Pad or truncate sequences on the left. The software truncates or adds padding to the start of each sequence so that the sequences end at the same time step.

    For sequence-to-sequence neural networks (when the recurrent layers output the full sequence), any padding in the first time steps can negatively influence the predictions for the earlier time steps. Right padding helps prevent this issue by ensuring that padding doesn't appear in the initial time steps.

    To learn more about the effects of padding and truncating sequences, see Sequence Padding and Truncation.

    Since R2026b

    Value for padding the input sequences, specified as a scalar.

    Do not pad sequences with NaN, because this will cause the function to error.

    Data Types: single | double | int8 | int16 | int32 | int64 | uint8 | uint16 | uint32 | uint64

    Since R2026b

    Encoding of categorical inputs, specified as one of these values:

    • "integer" — Convert categorical inputs to their integer value. In this case, the network must have one input channel for each of the categorical inputs.

    • "one-hot" — Convert categorical inputs to one-hot encoded vectors. In this case, the network must have numCategories channels for each of the categorical inputs, where numCategories is the number of categories of the corresponding categorical input.

    Since R2026b

    Description of the input data dimensions, specified as a string array, character vector, or cell array of character vectors.

    If InputDataFormats is "auto", then the software uses the formats expected by the network input. Otherwise, the software uses the specified formats for the corresponding network input.

    A deep learning data format is a string of characters, where each character describes the type of the corresponding data dimension. The characters are:

    • "S" — Spatial

    • "C" — Channel

    • "B" — Batch

    • "T" — Time

    • "U" — Unspecified

    For example, suppose you have an array that represents a batch of sequences where the first, second, and third dimensions correspond to channels, observations, and time steps, respectively. You can describe the data as having the format "CBT" (channel, batch, time).

    You can specify multiple dimensions labeled "S" or "U". You can use the labels "C", "B", and "T" at most once each. The software ignores singleton trailing "U" dimensions after the second dimension.

    For a neural network with multiple inputs net, specify an array of input data formats, where InputDataFormats(i) corresponds to the input net.InputNames(i).

    For more information, see Deep Learning Data Formats.

    Data Types: char | string | cell

    Output Arguments

    collapse all

    Distribution scores, returned as a numObservations-by-1 numeric array.

    More About

    collapse all

    References

    [1] Shalev, Gal, Gabi Shalev, and Joseph Keshet. “A Baseline for Detecting Out-of-Distribution Examples in Image Captioning.” In Proceedings of the 30th ACM International Conference on Multimedia, 4175–84. Lisboa Portugal: ACM, 2022. https://doi.org/10.1145/3503161.3548340.

    [2] Shiyu Liang, Yixuan Li, and R. Srikant, “Enhancing The Reliability of Out-of-distribution Image Detection in Neural Networks” arXiv:1706.02690 [cs.LG], August 30, 2020, http://arxiv.org/abs/1706.02690.

    [3] Weitang Liu, Xiaoyun Wang, John D. Owens, and Yixuan Li, “Energy-based Out-of-distribution Detection” arXiv:2010.03759 [cs.LG], April 26, 2021, http://arxiv.org/abs/2010.03759.

    [4] Markus Goldstein and Andreas Dengel. "Histogram-based outlier score (hbos): A fast unsupervised anomaly detection algorithm." KI-2012: poster and demo track 9 (2012).

    [5] Jingkang Yang, Kaiyang Zhou, Yixuan Li, and Ziwei Liu, “Generalized Out-of-Distribution Detection: A Survey” August 3, 2022, http://arxiv.org/abs/2110.11334.

    [6] Lee, Kimin, Kibok Lee, Honglak Lee, and Jinwoo Shin. “A Simple Unified Framework for Detecting Out-of-Distribution Samples and Adversarial Attacks.” arXiv, October 27, 2018. http://arxiv.org/abs/1807.03888.

    Extended Capabilities

    expand all

    Version History

    Introduced in R2023a

    expand all