Preprocess Lane Detections for Scenario Generation
This example shows how to preprocess lane detection data to organize it into a laneData object to generate scenarios using Scenario Builder for Automated Driving Toolbox™.
Scenario Builder for Automated Driving Toolbox provides workflows to generate high-definition (HD) scenes from lane detections. For more information on generating a scene from lane detections, see the Generate High Definition Scene from Lane Detections and OpenStreetMap example.
In this example, you organize detected or labeled lane boundary points into the laneData object as shown in the example Generate RoadRunner Scene Using Labeled Camera Images and Raw Lidar Data.
Desired Format of Lane Boundary Detections
The lane detections must follow the vehicle coordinate system used by Automated Driving Toolbox. As such, the Y-coordinate values for the lane boundary points to the left of the ego vehicle must be positive values and the lane boundary points to the right must be negative values. For more information on the vehicle coordinate system, see Coordinate Systems in Automated Driving Toolbox.
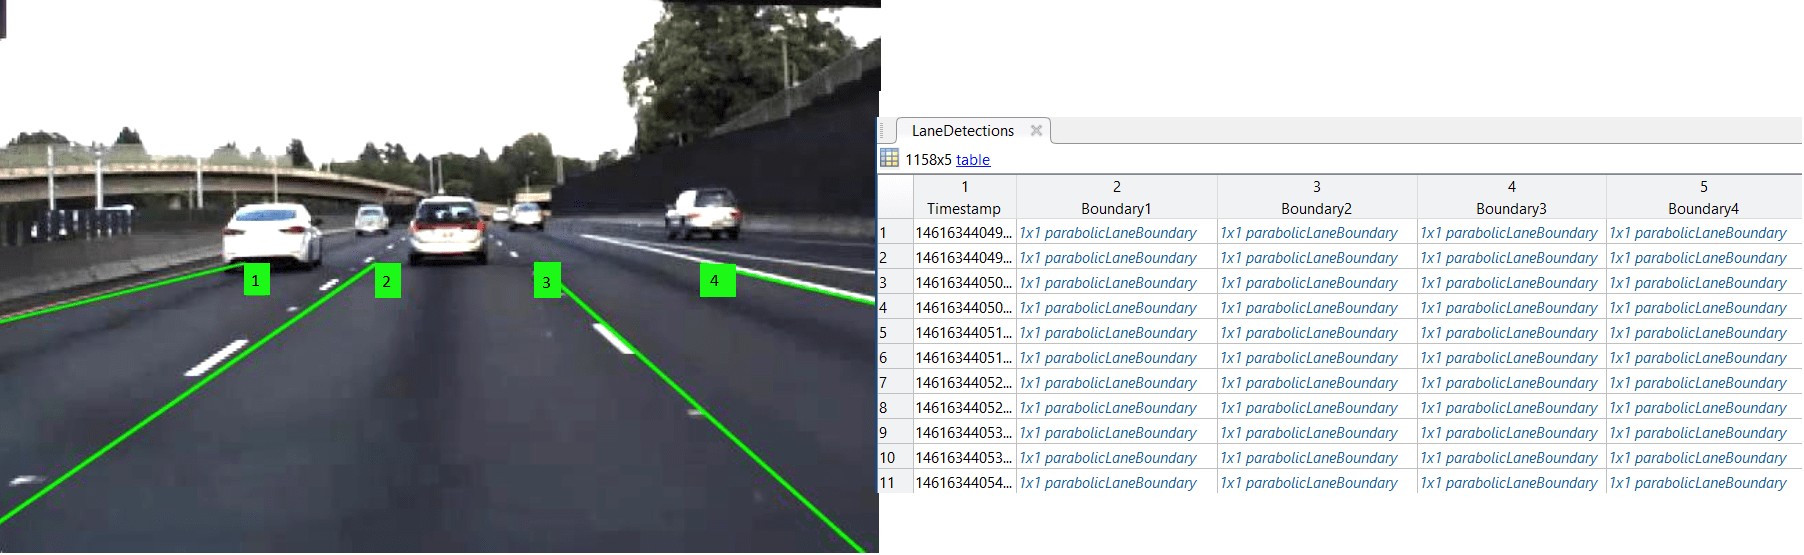
The laneData object must contain at least two lane boundaries of the ego lane for each timestamp. You must specify detected lane boundaries as parabolicLaneBoundary, cubicLaneBoundary, or clothoidLaneBoundary objects. The image shows a camera frame with overlaid lane boundary detections, and the data organization for the corresponding lane boundary data.
Inspect Lane Detection Data
This example requires Scenario Builder for Automated Driving Toolbox™ support package. Check if the support package is installed, if it is not installed, install it using the Get and Manage Add-Ons.
checkIfScenarioBuilderIsInstalled
This example shows how to generate lane boundary models from lane boundary points represented in the vehicle coordinate system. If your data specifies pixel locations for detected lane boundary points, you must convert them to vehicle coordinate system by using the imageToVehicle function.
This example uses raw lane detection data stored as a column vector of structures. Load the recorded lane detection data into the workspace, and display the fields of the first structure in the data.
load("LaneDetectionCoordinates.mat")
laneDetectionCoordinates(1)
ans = struct with fields:
timeStamp: 1461634404927776
left: [1×1 struct]
right: [1×1 struct]
secondLeft: [1×1 struct]
secondRight: [1×1 struct]
Each element of the vector is a structure with five fields. The first field contains the timestamp, and the remaining fields contains data for four lane boundaries. The left and right fields contains data for the left and right boundaries, respectively, of the ego lane. The secondLeft field contains data for the lane boundary to the left of the left ego lane boundary. The secondRight fields contains data for the lane boundary to the right of the right ego lane boundary.
The data for each lane boundary consists of a structure with two fields: lane boundary points and the boundary type.
Display the structure of the left boundary data for the first timestamp.
laneDetectionCoordinates(1).left
ans = struct with fields:
          Points: [11×2 double]
    BoundaryType: 1
You can use the findParabolicLaneBoundaries function to generate a parabolicLaneBoundary lane boundary model directly from the lane detection points. However, to generate a cubic or clothoid lane boundary model, you must first use the fitPolynomialRANSAC function to find the polynomial coefficients of the model, and then use the cubicLaneBoundary or clothoidLaneBoundary object, respectively. This example shows steps to generate cubic lane boundary model.
Find Coefficients of Lane Boundary Models
Find the cubic polynomial coefficients that fit the detected lane boundary points by using the fitPolynomialRANSAC function. Specify a degree of 3 and the maxDistance as half of the approximate boundary width. For this example, specify the approximate boundary width as 0.15 meters.
approxBoundaryWidth = 0.15;
Left = {};
Right = {};
SecondLeft = {};
SecondRight = {};

for i = 1:length(laneDetectionCoordinates)
    Left{i} = fitPolynomialRANSAC(laneDetectionCoordinates(i).left.Points,3,approxBoundaryWidth/2);
    Right{i} = fitPolynomialRANSAC(laneDetectionCoordinates(i).right.Points,3,approxBoundaryWidth/2);
    SecondLeft{i} = fitPolynomialRANSAC(laneDetectionCoordinates(i).secondLeft.Points,3,approxBoundaryWidth/2);
    SecondRight{i} = fitPolynomialRANSAC(laneDetectionCoordinates(i).secondRight.Points,3,approxBoundaryWidth/2);
end
The function returns the cubic polynomial coefficients required to generate the cubicLaneBoundary model.
Generate Lane Boundary Models
Generate a cubic lane boundary model from the cubic polynomial coefficients by using the cubicLaneBoundary object. By default, the cubicLaneBoundary object returns lane boundaries with a BoundaryType value of Solid. Update the types of lane boundaries by using the recorded lane detection data.
lanes = cell(length(laneDetectionCoordinates),1);
for i = 1:length(laneDetectionCoordinates)
    % left boundary
    left = cubicLaneBoundary(Left{i});
    left.BoundaryType = laneDetectionCoordinates(i).left.BoundaryType;
    % right boundary
    right = cubicLaneBoundary(Right{i});
    right.BoundaryType = laneDetectionCoordinates(i).right.BoundaryType;
    % second left boundary
    secondLeft = cubicLaneBoundary(SecondLeft{i});
    secondLeft.BoundaryType = laneDetectionCoordinates(i).secondLeft.BoundaryType;
    % second right boundary
    secondRight = cubicLaneBoundary(SecondRight{i});
    secondRight.BoundaryType = laneDetectionCoordinates(i).secondRight.BoundaryType;
    % store in lanes
    lanes{i,1} = [left, right, secondLeft, secondRight];
end
Store Data into Lane Data Object
Store the generated lane boundary models into laneData object.
laneDetections = laneData([laneDetectionCoordinates.timeStamp]',lanes)
laneDetections =
  laneData with properties:

           TimeStamp: [1158×1 double]
    LaneBoundaryData: {1158×1 cell}
     LaneInformation: []
           StartTime: 1.4616e+15
             EndTime: 1.4616e+15
          NumSamples: 1158
Read and display the first five entries of laneDetections object.
laneDetections.readData(RowIndices = (1:5)')
ans=5×5 table
    TimeStamp          LaneBoundary1              LaneBoundary2              LaneBoundary3              LaneBoundary4
    __________    _______________________    _______________________    _______________________    _______________________

    1.4616e+15    {1×1 cubicLaneBoundary}    {1×1 cubicLaneBoundary}    {1×1 cubicLaneBoundary}    {1×1 cubicLaneBoundary}
    1.4616e+15    {1×1 cubicLaneBoundary}    {1×1 cubicLaneBoundary}    {1×1 cubicLaneBoundary}    {1×1 cubicLaneBoundary}
    1.4616e+15    {1×1 cubicLaneBoundary}    {1×1 cubicLaneBoundary}    {1×1 cubicLaneBoundary}    {1×1 cubicLaneBoundary}
    1.4616e+15    {1×1 cubicLaneBoundary}    {1×1 cubicLaneBoundary}    {1×1 cubicLaneBoundary}    {1×1 cubicLaneBoundary}
    1.4616e+15    {1×1 cubicLaneBoundary}    {1×1 cubicLaneBoundary}    {1×1 cubicLaneBoundary}    {1×1 cubicLaneBoundary}
Note that the laneData object also supports variable number of lanes.
See Also
updateLaneSpec | imageToVehicle | findParabolicLaneBoundaries | cubicLaneBoundary | parabolicLaneBoundary
Topics
- Overview of Scenario Generation from Recorded Sensor Data
- Smooth GPS Waypoints for Ego Localization
- Extract Lane Information from Recorded Camera Data for Scene Generation
- Generate High Definition Scene from Lane Detections and OpenStreetMap
- Extract Vehicle Track List from Recorded Camera Data for Scenario Generation
- Generate Scenario from Actor Track Data and GPS Data