Transform Between Time-Domain and Frequency-Domain Data
You can transform your data from one domain to the other. The table summarizes the commands for transforming data between the time and frequency domains. For more command information, see the corresponding command reference pages.
| Command | Description | Syntax Example |
|---|---|---|
fft | Transform time-domain data to the frequency domain. You can specify
| To transform time-domain f_data = fft(t_data,N) |
ifft | Transform frequency-domain data to the time domain. Frequencies are linear and equally spaced. | To transform frequency-domain t_data = ifft(f_data) |
Converting iddata data into the form of an idfrd frequency response is a type of estimation. If you want to estimate the
frequency response using an iddata object, see Transforming Between Frequency-Domain and Frequency-Response Data.
Transform Data Between Time and Frequency Domains
Transform data from the time domain to the frequency domain and back to the time domain, and compare performance for models estimated from the original and transformed data.
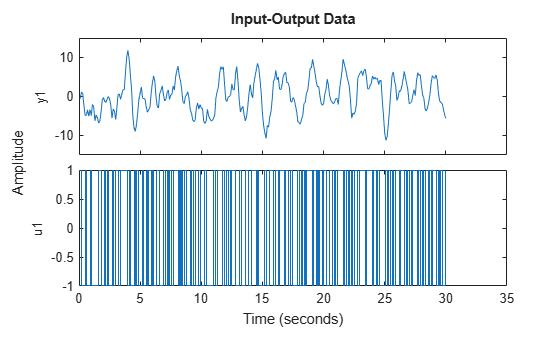
Load and plot the time-domain data z1, which contains 300 samples.
load iddata1 z1
plot(z1)
Find the sample time Ts of z1.
Ts = z1.Ts
Ts =
0.1000
The sample time is 0.1 s.
Transform z1 into the frequency domain.
z1f = fft(z1)
z1f =
Frequency domain data set with responses at 151 frequencies.
Frequency range: 0 to 31.416 rad/seconds
Sample time: 0.1 seconds

Outputs      Unit (if specified)
   y1

Inputs       Unit (if specified)
   u1

Data Properties
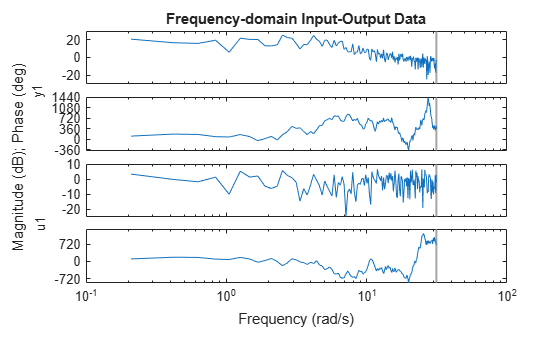
The frequency range extends to 31.416 rad/s, which is equal to the Nyquist frequency of pi/Ts.
Plot the frequency-domain data.
plot(z1f)
Transform z1f back to the time domain and plot the two time-domain signals together.
z1t = ifft(z1f)
z1t =
Time domain data set with 300 samples.
Sample time: 0.1 seconds

Outputs      Unit (if specified)
   y1

Inputs       Unit (if specified)
   u1

Data Properties
plot(z1t,z1)
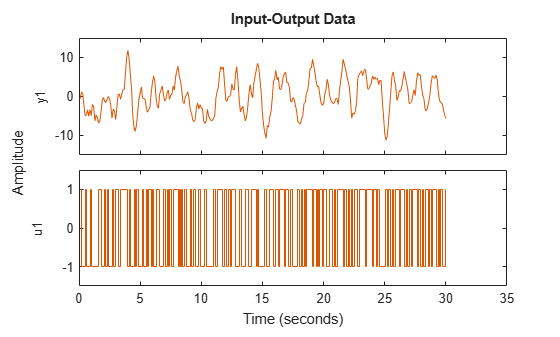
The signals line up precisely.
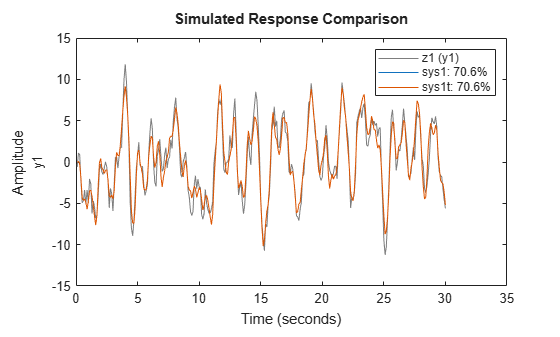
Estimate second-order state-space models for z1 and z1t.
sys1 = ssest(z1,2);
sys1t = ssest(z1t,2);
compare(z1,sys1,sys1t)
Estimate a state-space model for z1f.
sys1f = ssest(z1f,2);
compare(z1f,sys1f)
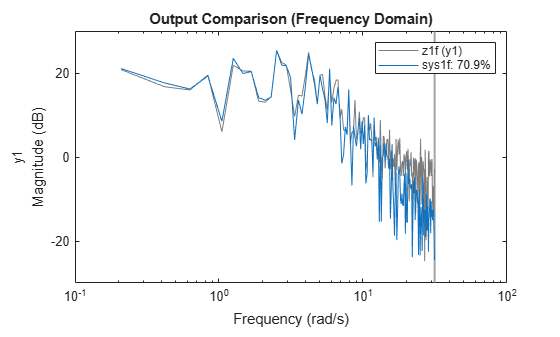
The fit percentages for the time-domain and frequency-domain models are similar.
See Also
fft | iddata | ifft | etfe | spa | spafdr