Surface
Description
A Surface object displays a 3-D surface within a scene.
Properties of the object control the appearance and behavior of the surface.
Creation
Description
s = images.ui.graphics3d.Surface(viewer) creates a
Surface object and sets the Parent
property as the specified 3-D viewer viewer. Use
s to query and modify properties of the Surface
object after you create the object.
s = images.ui.graphics3d.Surface(viewer,
also sets properties of the object
using one or more name-value arguments.Name=Value)
For example, images.ui.graphics3d.Surface(viewer,Alpha=0.5) creates
a Surface object with a transparency of 0.5.
Properties
Data — Surface grayscale data
3-D logical array | triangulation object
Surface grayscale data displayed in the viewer, specified as a 3-D logical array
with nonsingleton dimensions or as a triangulation object containing 3-D points.
Visible — Object is visible
"on" (default) | on/off logical value
Object is visible in the 3-D scene, specified as
Transformation — Transformation applied to surface
affinetform3d object | rigidtform3d object | simtform3d object | transltform3d object
Transformation applied to the surface in the 3-D scene, specified as an affinetform3d, rigidtform3d,
simtform3d,
or transltform3d
object. Use the Transformationaffinetform3d object that
performs an identity transformation.
Alpha — Transparency of surface
0.15 (default) | number in range [0, 1]
Transparency of the surface, specified as a number in the range [0, 1].
Color — Color of surface
RGB triplet | color name | short color name | n-by-3 numeric matrix
Color of the surface, specified as one of these values.
RGB triplet, color name, or short color name — Use the same color for all the vertices on the surface.
n-by-3 numeric matrix representing n RGB triplets — Use a different color for each vertex on the surface. Each row of the matrix defines one color. The number of rows must equal the number of vertices.
You can specify any color using an RGB triplet. An RGB triplet is a 3-element row vector whose elements specify the intensities of the red, green, and blue components of the color. The intensities must be in the range [0, 1].
You can specify some common colors by name as a string scalar or character vector. This table lists the named color options and the equivalent RGB triplets.
| Color Name | Short Name | RGB Triplet | Appearance |
|---|---|---|---|
"red" | "r" | [1 0 0] |
|
"green" | "g" | [0 1 0] |
|
"blue" | "b" | [0 0 1] |
|
"cyan"
| "c" | [0 1 1] |
|
"magenta" | "m" | [1 0 1] |
|
"yellow" | "y" | [1 1 0] |
|
"black" | "k" | [0 0 0] |
|
"white" | "w" | [1 1 1] |
|
Here are the RGB triplets for the default colors that MATLAB® uses in many types of plots.
| RGB Triplet | Appearance |
|---|---|
[0 0.4470 0.7410] |
|
[0.8500 0.3250 0.0980] |
|
[0.9290 0.6940 0.1250] |
|
[0.4940 0.1840 0.5560] |
|
[0.4660 0.6740 0.1880] |
|
[0.3010 0.7450 0.9330] |
|
[0.6350 0.0780 0.1840] |
|
Example: Color="r"
Example: Color="green"
Example: Color=[0 0.4470 0.7410]
ClippingPlanes — Clipping planes
[] (default) | N-by-4 matrix
Clipping planes applied locally to the object, specified as an N-by-4 matrix where each row corresponds to the equation for a clipping plane. The maximum number of clipping planes N is six. Each clipping plane is specified as a 1-by-4 vector, in world coordinates, following the Hessian normal form where the first three values represent the normal vector of the plane and the fourth value is the signed distance from the origin to the plane.
Wireframe — Display surface as wireframe mesh
"off" (default) | on/off logical value
Display surface as wireframe mesh, specified as
When this value is "on", the surface is rendered as a wireframe
mesh. When this value is "off", the faces are rendered according to
the color and transparency of the object.
Examples
Display Labels as Colored Surfaces Within Volume
Load a 3-D image and corresponding label data.
datadir = fullfile(toolboxdir("images"),"imdata","BrainMRILabeled");
load(fullfile(datadir,"images","vol_001.mat"))
load(fullfile(datadir,"labels","label_001.mat"))
The label data has three classes. Create binary masks for each class.
mask1 = (label == 1);
mask2 = (label == 2);
mask3 = (label == 3);
Display the scene using a Viewer3D object.
viewer = viewer3d;
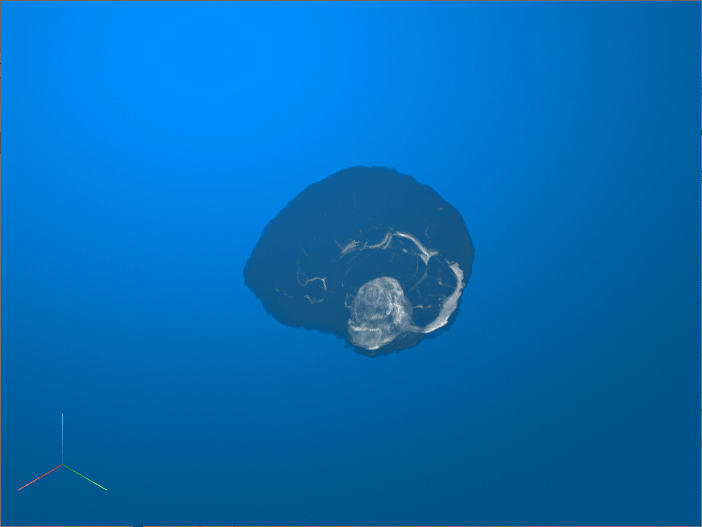
Display the image data using a Volume object. Render the image data using maximum intensity projection.
obj = volshow(vol,Parent=viewer, ...
    RenderingStyle="MaximumIntensityProjection");
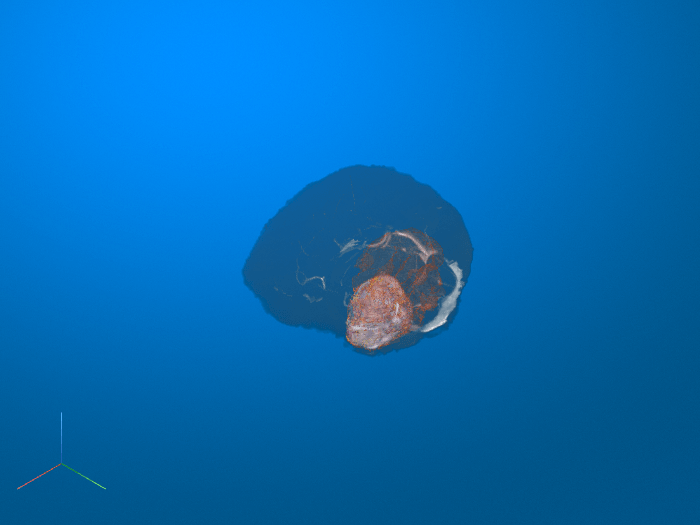
Create three Surface objects, one for each class. Display the surfaces using the lines colormap. Skip the first color, which is a shade of blue that is similar to the color of the scene. The three surfaces appear red, yellow, and purple, respectively.
cmap = lines;
surf1 = images.ui.graphics3d.Surface(viewer,Color=cmap(2,:),Data=mask1);
surf2 = images.ui.graphics3d.Surface(viewer,Color=cmap(3,:),Data=mask2);
surf3 = images.ui.graphics3d.Surface(viewer,Color=cmap(4,:),Data=mask3);
More About
Version History
Introduced in R2022b
You can also select a web site from the following list:
Americas
- América Latina (Español)
- Canada (English)
- United States (English)
Europe
- Belgium (English)
- Denmark (English)
- Deutschland (Deutsch)
- España (Español)
- Finland (English)
- France (Français)
- Ireland (English)
- Italia (Italiano)
- Luxembourg (English)
- Netherlands (English)
- Norway (English)
- Österreich (Deutsch)
- Portugal (English)
- Sweden (English)
- Switzerland
- United Kingdom (English)