Main Content

axtoolbar

Create axes toolbar

Description

tb = axtoolbar(buttons) replaces the default toolbar that appears near the top-right corner of the current axes with a toolbar that contains only the specified buttons. For example, axtoolbar({"pan","restoreview"}) specifies a button to pan and a button to restore the original view. You can interact with the toolbar using a mouse, a keyboard, or a touch screen. The function returns the AxesToolbar object created.

example

tb = axtoolbar(target,buttons) replaces the toolbar for the axes or tiled chart layout specified by target.

example

tb = axtoolbar replaces the toolbar for the current axes with a toolbar without buttons.

tb = axtoolbar(target) replaces the toolbar for the specified axes or tiled chart layout with a toolbar without buttons.

tb = axtoolbar(___,Name=Value) specifies options using one or more name-value arguments in addition to any of the input argument combinations in previous syntaxes. For example, to expand the toolbar, set Expanded to "on".

example

[tb,btns] = axtoolbar(___) also returns the toolbar button objects created, which are either ToolbarStateButton, ToolbarPushButton, or ToolbarDropdown objects. You can use the objects to modify the toolbar and toolbar buttons after you create them.

example

Examples

collapse all

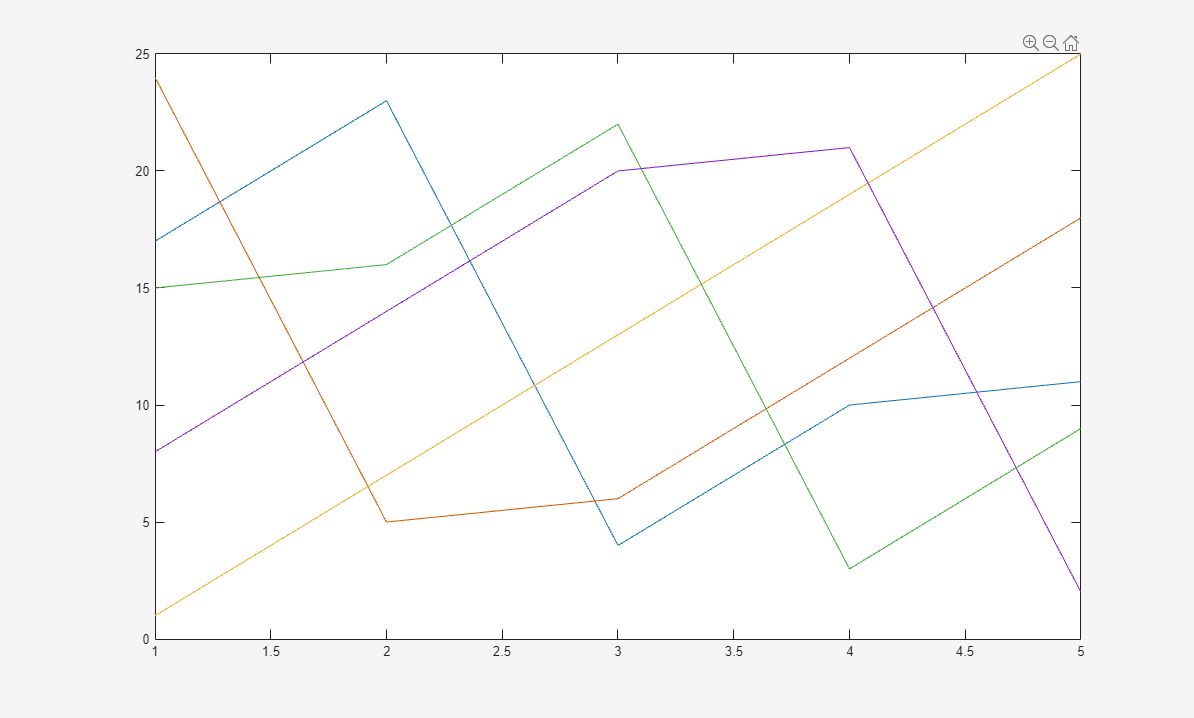
Create a plot. Replace the default axes toolbar with a custom toolbar that includes only buttons to zoom and restore the view. Use Expanded="on" to show the toolbar in an expanded state. Return the AxesToolbar object and the button objects created as output arguments.

plot(magic(5))
[tb,btns] = axtoolbar({"zoom","restoreview"}, Expanded="on");

Figure with zoom and restore view buttons in the axes toolbar

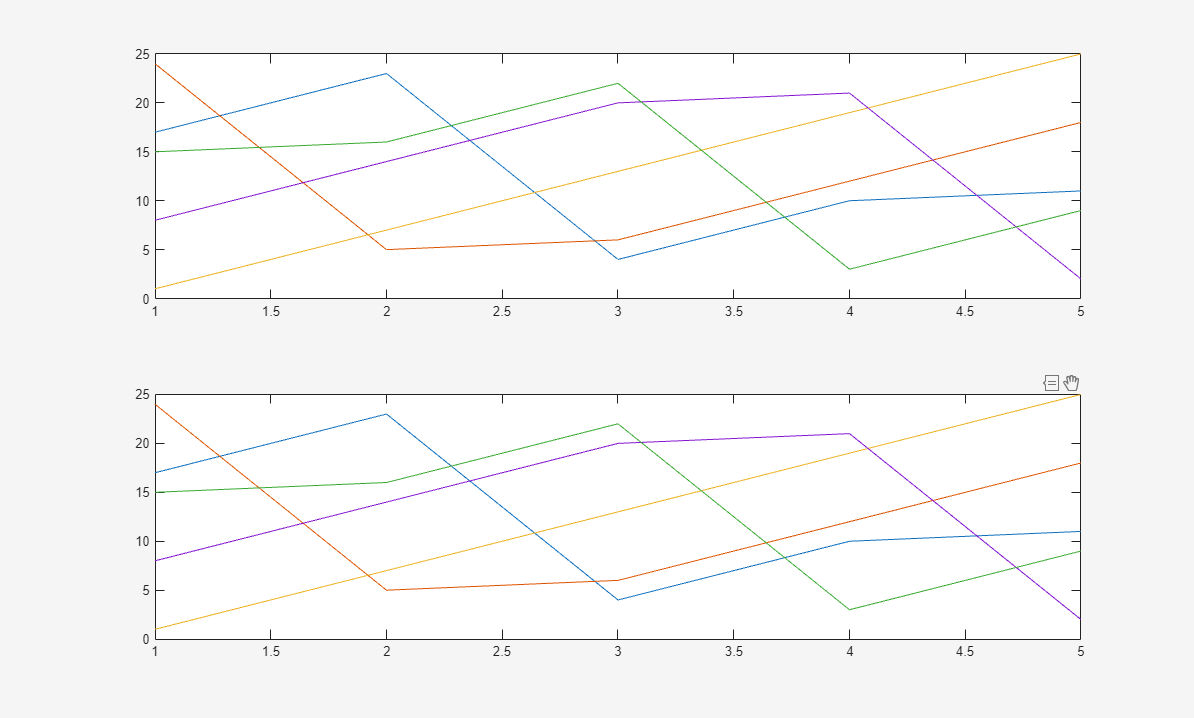
Create a tiled chart layout containing two subplots with a custom toolbar for each plot.

First, create a tiled chart layout. In the first subplot, replace the toolbar with a custom toolbar by calling the axtoolbar function and specifying buttons as the cell array {"zoom","restoreview"}. Then, replace the toolbar for the second subplot. Click the Expand axes toolbar button in each subplot to see its toolbar.

tiledlayout

nexttile
plot(magic(5))
[tb1,btns1] = axtoolbar({"zoom","restoreview"});

nexttile
plot(magic(5))
[tb2,btns2] = axtoolbar({"pan","datacursor"});

Figure with two plots. The top plot has zoom and restore view buttons in the axes toolbar. The bottom plot has data tip and pan buttons in the axes toolbar.

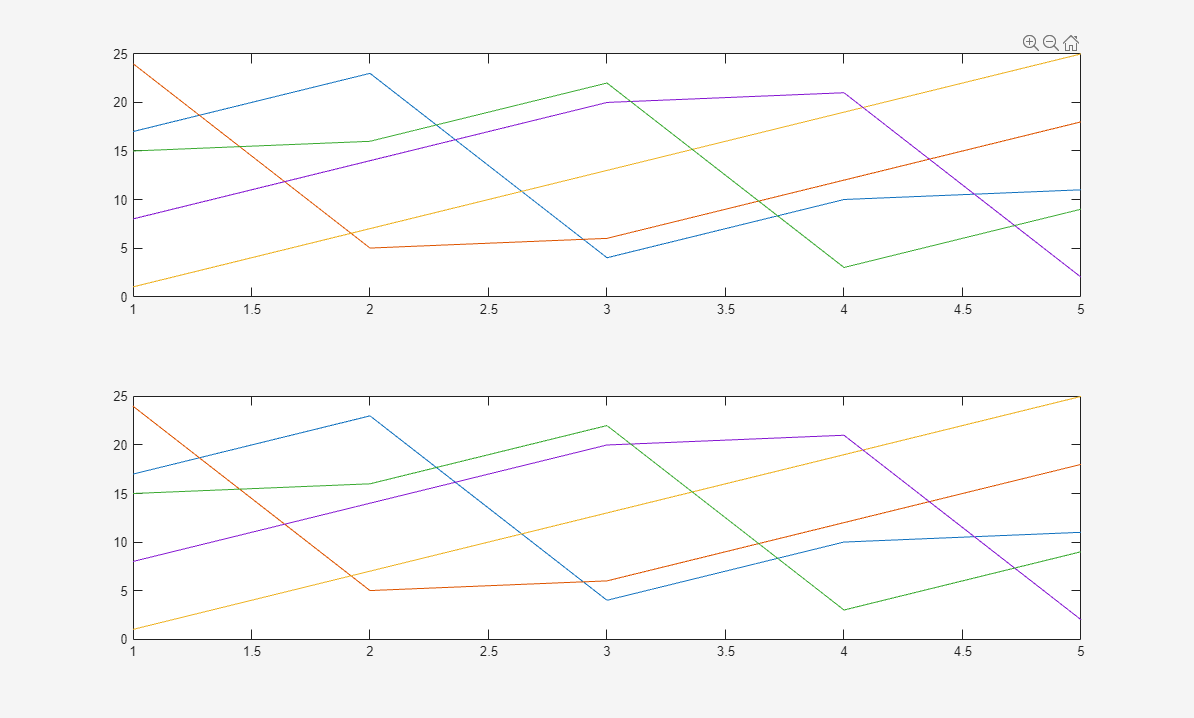
Create a tiled chart layout with a single shared axes toolbar.

First, create a 2-by-1 layout and display a different chart in each tile. Then, create a custom axes toolbar for the tiled chart layout. Display the toolbar by clicking the Expand axes toolbar button.

t = tiledlayout(2,1);
nexttile
plot(magic(5))
nexttile
plot(magic(5))

tb = axtoolbar(t, {"zoom","pan","restoreview"});

Figure with two plots sharing a single axes toolbar. The toolbar has pan, zoom, and restore view buttons.

Input Arguments

collapse all

Target for the toolbar, specified as an Axes object or a TiledChartLayout object. Specify target as a TiledChartLayout object to use a single toolbar for a tiled chart layout that contains more than one axes.

Toolbar buttons, specified as "default" or a cell vector of button names. If target is an Axes object, then you can specify buttons as "default" for the default set of buttons. Otherwise, specify buttons as a cell vector containing zero or more of the button names in this table.

NameIconAxes or UIAxes objectPolarAxes objectGeographicAxes or MapAxes objectTiledChartLayout objectDescription
"export" 111Display menu of export options.
"brush"1  Toggle data brushing mode.
"datacursor" 111Toggle data cursor mode.
"rotate"2  Toggle rotate mode.
"pan"1  Toggle pan mode.
"zoom"1  Toggle zoom mode.
"restoreview"1 1Restore original view of target.
N/A  1 Zoom in toward map center.
N/A  1 Zoom out from map center.
"zoomin"3  3Toggle zoom mode.
"zoomout"3  3Toggle zoom out mode.

1 — These buttons are default buttons for their respective target types.

2 — This button is a default button only for 3-D axes.

3 — These buttons are not recommended. When zoom mode is enabled, you can zoom out by scrolling down on the scroll wheel or by pressing the down arrow (↓) key. The functionality of the "zoomin" button is identical to that of the "zoom" button.

Clicking the Export button in the axes toolbar displays a menu with these options for exporting the axes or tiled chart layout content.

ButtonAction
Save the content as a tightly cropped image or PDF.
Copy the content as an image.
Copy the content as a vector graphic. This option is available only if the target is an Axes, UIAxes, or PolarAxes object.

The specified buttons appear in a standard order on the toolbar, regardless of the order in which you specify them. The specified buttons also appear no more than one time each, regardless of the number of times they appear in the buttons vector.

Example: {"zoom","pan","restoreview"}

Name-Value Arguments

collapse all

Specify optional pairs of arguments as Name1=Value1,...,NameN=ValueN, where Name is the argument name and Value is the corresponding value. Name-value arguments must appear after other arguments, but the order of the pairs does not matter.

Example: axtoolbar("default",Expanded="on") creates a custom toolbar with the default set of buttons, in the expanded state.

Note

You can set any property of an AxesToolbar object using a name-value argument. The properties listed here are only a subset. For the complete list, see AxesToolbar Properties.

Since R2026a

State of expansion, specified as "on" or "off", or as numeric or logical 1 (true) or 0 (false). A value of "on" is equivalent to true, and "off" is equivalent to false. Thus, you can use the value of this property as a logical value. The value is stored as an on/off logical value of type matlab.lang.OnOffSwitchState.

  • "off" — The toolbar is collapsed.

  • "on" — The toolbar is expanded.

Callback for selection changes, specified as one of these values:

  • A function handle

  • Cell array in which the first element is a function handle and subsequent elements are the arguments to pass to the callback function

  • String scalar or character vector containing a valid MATLAB® command or function, which is evaluated in the base workspace (not recommended)

This callback executes when you click a state button. It does not execute if a state button Value property changes programmatically.

This callback function can access specific information about interaction with the buttons. MATLAB passes this information in a SelectionChangedEventData object as the second argument to your callback function. You can query the object properties using dot notation. For example, event.Selection returns the currently selected button. The SelectionChangedEventData object is not available to callback functions specified as string scalars or character vectors.

This table lists the properties of the SelectionChangedEventData object.

Property

Description

Axes

Array of Axes objects associated with the toolbar

Selection

Most recently clicked ToolbarStateButton object

PreviousSelection

Second most recently clicked ToolbarStateButton object

Source

AxesToolbar object

EventName

'SelectionChanged'

Visibility of the axes toolbar, specified as "on" or "off", or as numeric or logical 1 (true) or 0 (false). A value of "on" is equivalent to true, and "off" is equivalent to false. Thus, you can use the value of this property as a logical value. The value is stored as an on/off logical value of type matlab.lang.OnOffSwitchState.

  • "on" — Display the toolbar above the top-right corner of the axes.

  • "off" — Do not display the toolbar. You still can access the properties of an invisible toolbar.

Note

When you set Visible to "off", the axes toolbar continues to exist. If you want to remove the toolbar entirely, set the Toolbar property of the parent Axes or TiledChartLayout object to [].

Output Arguments

collapse all

Toolbar, returned as an AxesToolbar object. Use tb to modify the toolbar after you create it. For a list of properties, see AxesToolbar Properties.

Toolbar buttons, returned as a graphics array containing zero or more ToolbarPushButton, ToolbarStateButton, or ToolbarDropdown objects. Use the elements in the btns array to modify the buttons after you create them. For lists of properties, see ToolbarStateButton Properties, ToolbarPushButton Properties, and ToolbarDropdown Properties.

Tips

  • If you want to modify the behavior or properties of one of the default toolbar buttons, then use the axtoolbarbtn function to create and use a new button in place of the default button. You can still use the icon of the default button.

Version History

Introduced in R2018b

expand all