griddedInterpolant
Gridded data interpolation
Description
Use griddedInterpolant to perform interpolation on a 1-D,
2-D, 3-D, or N-D gridded data set.
griddedInterpolant returns the interpolant
F for the given data set. You can evaluate F at a
set of query points, such as (xq,yq) in 2-D, to produce interpolated
values vq = F(xq,yq).
Use scatteredInterpolant to perform
interpolation with scattered data.
Creation
Syntax
Description
F = griddedInterpolant
F = griddedInterpolant(X1,X2,...,Xn,V)n-dimensional arrays X1,X2,...,Xn. The
V array contains the sample values associated with the
point locations in X1,X2,...,Xn. Each of the arrays
X1,X2,...,Xn must be the same size as
V.
F = griddedInterpolant(V)griddedInterpolant defines the grid as a
set of points whose spacing is 1 and range is
[1, size(V,i)] in the
ith dimension. Use this syntax when you want to conserve
memory and are not concerned about the absolute distances between points.
F = griddedInterpolant(gridVecs,V)gridVecs that contains
n
grid vectors to
describe an n-dimensional grid of sample points. Use this
syntax when you want to use a specific grid and also conserve memory.
F = griddedInterpolant(___,Method)'linear',
'nearest', 'next',
'previous', 'pchip',
'cubic', 'makima', or
'spline'. You can specify Method as
the last input argument in any of the previous syntaxes.
F = griddedInterpolant(___,Method,ExtrapolationMethod)griddedInterpolant uses
ExtrapolationMethod to estimate the value when your query
points fall outside the domain of your sample points.
Input Arguments
Properties
Usage
Description
Use griddedInterpolant to create the interpolant,
F. Then you can evaluate F at specific
query points using any of the following syntaxes:
Vq = F(Xq) specifies the query points in the matrix
Xq. Each row of Xq contains the
coordinates of a query point.
Vq = F(xq1,xq2,...,xqn) specifies the query points
xq1,xq2,...,xqn as column vectors of length
m, representing m points scattered in
n-dimensional space.
Vq = F(Xq1,Xq2,...,Xqn) specifies the query points using
the n-dimensional arrays Xq1,Xq2,...,Xqn,
which define a full grid of
points.
Vq = F({xgq1,xgq2,...,xgqn}) specifies the query points
as grid vectors. Use
this syntax to conserve memory when you want to query a large grid of
points.
Examples
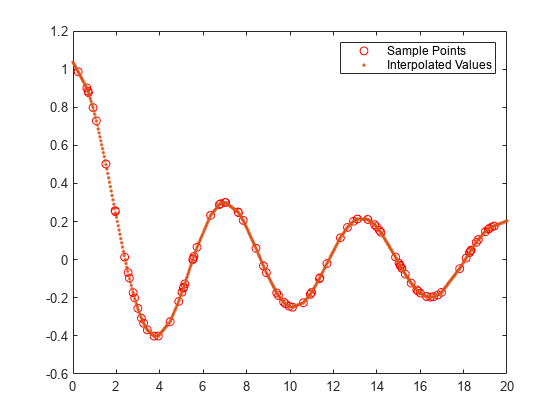
Use griddedInterpolant to interpolate a 1-D data set.
Create a vector of scattered sample points v. The points are sampled at random 1-D locations between 0 and 20.
x = sort(20*rand(100,1));
v = besselj(0,x);
Create a gridded interpolant object for the data. By default, griddedInterpolant uses the 'linear' interpolation method.
F = griddedInterpolant(x,v)
F =
  griddedInterpolant with properties:

            GridVectors: {[100×1 double]}
                 Values: [100×1 double]
                 Method: 'linear'
    ExtrapolationMethod: 'linear'
Query the interpolant F at 500 uniformly spaced points between 0 and 20. Plot the interpolated results (xq,vq) on top of the original data (x,v).
xq = linspace(0,20,500);
vq = F(xq);
plot(x,v,'ro')
hold on
plot(xq,vq,'.')
legend('Sample Points','Interpolated Values')
Interpolate 3-D data using two methods to specify the query points.
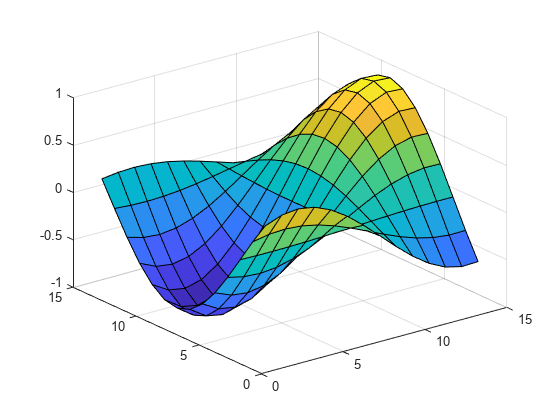
Create and plot a 3-D data set representing the function evaluated at a set of gridded sample points in the range [-5,5].
[x,y] = ndgrid(-5:0.8:5);
z = sin(x.^2 + y.^2) ./ (x.^2 + y.^2);
surf(x,y,z)
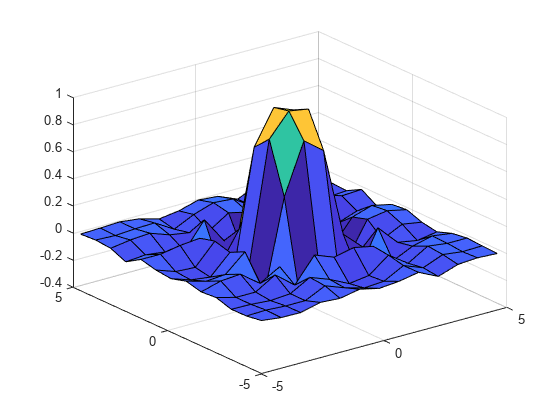
Create a gridded interpolant object for the data.
F = griddedInterpolant(x,y,z);
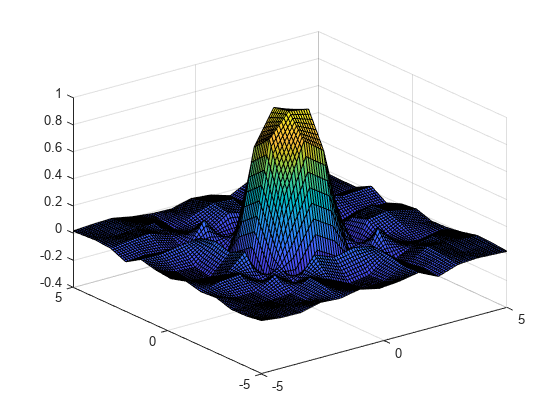
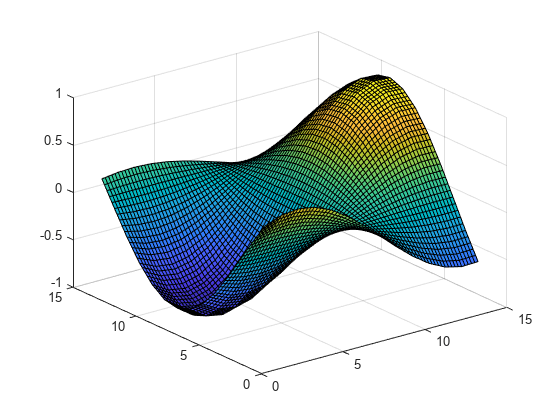
Use a finer mesh to query the interpolant and improve the resolution.
[xq,yq] = ndgrid(-5:0.1:5);
vq = F(xq,yq);
surf(xq,yq,vq)
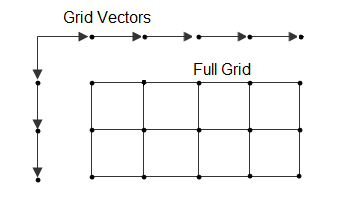
In cases where there are a lot of sample points or query points, and where memory usage becomes a concern, you can use grid vectors to improve memory usage.
When you specify grid vectors instead of using
ndgridto create the full grid,griddedInterpolantavoids forming the full query grid to carry out the calculations.When you pass grid vectors, they are normally grouped together as cells in a cell array,
{xg1, xg2, ..., xgn}. The grid vectors are a compact way to represent the points of the full grid.
Alternatively, execute the previous commands using grid vectors.
x = -5:0.8:5;
y = x';
z = sin(x.^2 + y.^2) ./ (x.^2 + y.^2);
F = griddedInterpolant({x,y},z);
xq = -5:0.1:5;
yq = xq';
vq = F({xq,yq});
surf(xq,yq,vq)
Use the default grid to perform a quick interpolation on a set of sample points. The default grid uses unit-spaced points, so this interpolation is useful when the exact xy spacing between the sample points is not important.
Create a matrix of sample function values and plot them against the default grid.
x = (1:0.3:5)';
y = x';
V = cos(x) .* sin(y);
n = length(x);
surf(1:n,1:n,V)
Interpolate the data using the default grid.
F = griddedInterpolant(V)
F =
  griddedInterpolant with properties:

            GridVectors: {[1 2 3 4 5 6 7 8 9 10 11 12 13 14]  [1 2 3 4 5 6 7 8 9 10 11 12 13 14]}
                 Values: [14×14 double]
                 Method: 'linear'
    ExtrapolationMethod: 'linear'
Query the interpolant and plot the results.
[xq,yq] = ndgrid(1:0.2:n);
Vq = F(xq,yq);
surf(xq',yq',Vq)
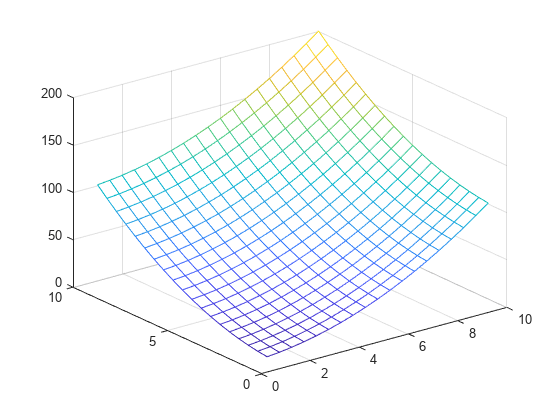
Interpolate coarsely sampled data using a full grid with spacing of 0.5.
Define the sample points as a full grid with range [1, 10] in both dimensions.
[X,Y] = ndgrid(1:10,1:10);
Sample at the grid points.
V = X.^2 + Y.^2;
Create the interpolant, specifying cubic interpolation.
F = griddedInterpolant(X,Y,V,'cubic');Define a full grid of query points with 0.5 spacing and evaluate the interpolant at those points. Then plot the result.
[Xq,Yq] = ndgrid(1:0.5:10,1:0.5:10);
Vq = F(Xq,Yq);
mesh(Xq,Yq,Vq);
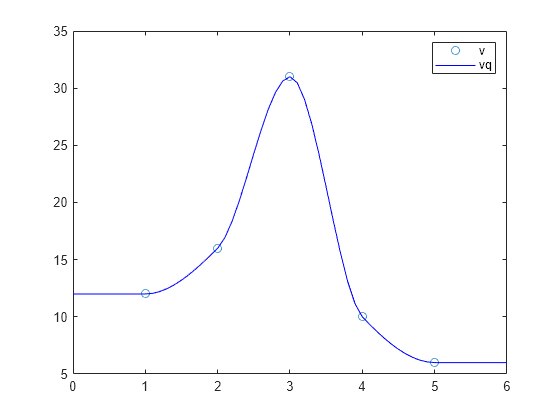
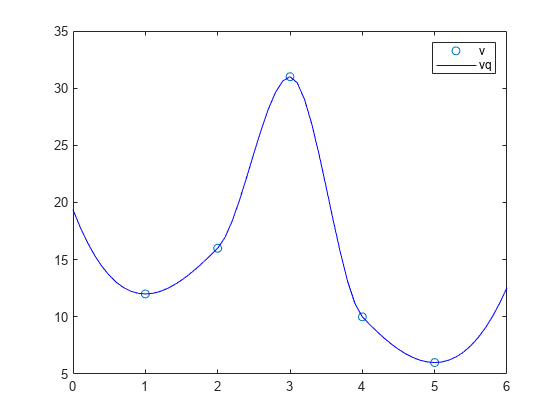
Compare results of querying the interpolant outside the domain of F using the 'pchip' and 'nearest' extrapolation methods.
Create the interpolant, specifying 'pchip' as the interpolation method and 'nearest' as the extrapolation method.
x = [1 2 3 4 5];
v = [12 16 31 10 6];
F = griddedInterpolant(x,v,'pchip','nearest')
F =
  griddedInterpolant with properties:

            GridVectors: {[1 2 3 4 5]}
                 Values: [12 16 31 10 6]
                 Method: 'pchip'
    ExtrapolationMethod: 'nearest'
Query the interpolant, and include points outside the domain of F.
xq = 0:0.1:6;
vq = F(xq);
figure
plot(x,v,'o',xq,vq,'-b');
legend ('v','vq')
Query the interpolant at the same points again, this time using the 'pchip' extrapolation method.
F.ExtrapolationMethod = 'pchip';
figure
vq = F(xq);
plot(x,v,'o',xq,vq,'-b');
legend ('v','vq')
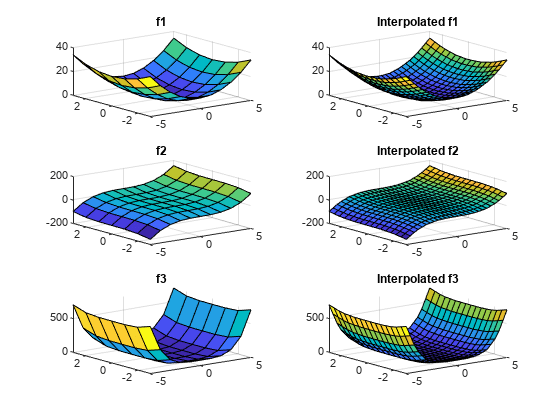
Use griddedInterpolant to interpolate three different sets of values at the same query points.
Create a grid of sample points with and .
gx = -5:5;
gy = -3:3;
[X,Y] = ndgrid(gx,gy);
Evaluate three functions at the sample points. Then, concatenate the sample values into a 3-D array, where each 2-D page corresponds to values from one function. V contains three pages, which is the number of sample values for each sample point. Each page in V has the same size as the X and Y grids.
f1 = X.^2 + Y.^2;
f2 = X.^3 + Y.^3;
f3 = X.^4 + Y.^4;
V = cat(3,f1,f2,f3);
Create an interpolant using the sample points and sample values.
F = griddedInterpolant(X,Y,V);
Create a grid of query points with a finer mesh size compared to the sample points.
qx = -5:0.4:5;
qy = -3:0.4:3;
[XQ,YQ] = ndgrid(qx,qy);
Evaluate the interpolant at the query points in each 2-D page.
VQ = F(XQ,YQ);
Compare the original data with the interpolated results.
tiledlayout(3,2)
nexttile

surf(X,Y,f1)
title("f1")

nexttile
surf(XQ,YQ,VQ(:,:,1))
title("Interpolated f1")

nexttile
surf(X,Y,f2)
title("f2")

nexttile
surf(XQ,YQ,VQ(:,:,2))
title("Interpolated f2")

nexttile
surf(X,Y,f3)
title("f3")

nexttile
surf(XQ,YQ,VQ(:,:,3))
title("Interpolated f3")
More About
Tips
It is quicker to evaluate a
griddedInterpolantobjectFat many different sets of query points than it is to compute the interpolations separately usinginterp1,interp2,interp3, orinterpn. For example:% Fast to create interpolant F and evaluate multiple times F = griddedInterpolant(X1,X2,V) v1 = F(Xq1) v2 = F(Xq2) % Slower to compute interpolations separately using interp2 v1 = interp2(X1,X2,V,Xq1) v2 = interp2(X1,X2,V,Xq2)
Extended Capabilities
Version History
Introduced in R2011bSee Also
scatteredInterpolant | interp1 | interp2 | interp3 | interpn | ndgrid | meshgrid | fillmissing | filloutliers