splitvars
Split multicolumn variables in table or timetable
Description
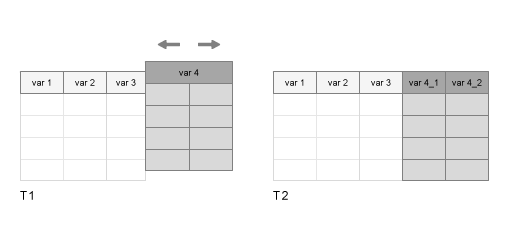
T2 = splitvars(T1)T1 so that they are
single-column variables in T2. All single-column variables from
T1 are unaltered.
If a variable in
T1has multiple columns, thensplitvarsmakes unique names for the new variables inT2from the name of the original variable inT1.If a variable in
T1is a table itself, thensplitvarsuses the names of its variables (and, if necessary, the name of that table) to make unique names for the new variables inT2.
To merge variables into one multicolumn variable, use the mergevars function.
Examples
Create a table from workspace variables. Some of the variables are matrices with multiple columns.
A = (1:3)';
B = [5 11 12; 20 30 50; 0.1 3.4 5.9]';
C = ["a" "XX";"b" "YY";"c" "ZZ"];
D = [128 256 512]';
T1 = table(A,B,C,D)
T1=3×4 table
    A           B                 C          D
    _    ________________    ___________    ___

    1     5     20    0.1    "a"    "XX"    128
    2    11     30    3.4    "b"    "YY"    256
    3    12     50    5.9    "c"    "ZZ"    512
Split the variables B and C. All variables in the output table have one column.
T2 = splitvars(T1)
T2=3×7 table
    A    B_1    B_2    B_3    C_1    C_2      D
    _    ___    ___    ___    ___    ____    ___

    1     5     20     0.1    "a"    "XX"    128
    2    11     30     3.4    "b"    "YY"    256
    3    12     50     5.9    "c"    "ZZ"    512
Create a table that contains tables, using arrays of data from the patients.mat file.
load patients
Personal_Data = table(Age,Smoker);
BMI_Data = table(Height,Weight);
BloodPressure = table(Systolic,Diastolic);
LastName = string(LastName);
T1 = table(LastName,Personal_Data,BMI_Data,BloodPressure)T1=100×4 table
LastName Personal_Data BMI_Data BloodPressure
__________ _____________ ________________ _____________________
Age Smoker Height Weight Systolic Diastolic
___ ______ ______ ______ ________ _________
"Smith" 38 true 71 176 124 93
"Johnson" 43 false 69 163 109 77
"Williams" 38 false 64 131 125 83
"Jones" 40 false 67 133 117 75
"Brown" 49 false 64 119 122 80
"Davis" 46 false 68 142 121 70
"Miller" 33 true 64 142 130 88
"Wilson" 40 false 68 180 115 82
"Moore" 28 false 68 183 115 78
"Taylor" 31 false 66 132 118 86
"Anderson" 45 false 68 128 114 77
"Thomas" 42 false 66 137 115 68
"Jackson" 25 false 71 174 127 74
"White" 39 true 72 202 130 95
"Harris" 36 false 65 129 114 79
"Martin" 48 true 71 181 130 92
⋮
Specify BloodPressure as the variable to split.
T2 = splitvars(T1,"BloodPressure")T2=100×5 table
LastName Personal_Data BMI_Data Systolic Diastolic
__________ _____________ ________________ ________ _________
Age Smoker Height Weight
___ ______ ______ ______
"Smith" 38 true 71 176 124 93
"Johnson" 43 false 69 163 109 77
"Williams" 38 false 64 131 125 83
"Jones" 40 false 67 133 117 75
"Brown" 49 false 64 119 122 80
"Davis" 46 false 68 142 121 70
"Miller" 33 true 64 142 130 88
"Wilson" 40 false 68 180 115 82
"Moore" 28 false 68 183 115 78
"Taylor" 31 false 66 132 118 86
"Anderson" 45 false 68 128 114 77
"Thomas" 42 false 66 137 115 68
"Jackson" 25 false 71 174 127 74
"White" 39 true 72 202 130 95
"Harris" 36 false 65 129 114 79
"Martin" 48 true 71 181 130 92
⋮
To specify multiple variables by name, use a string array.
T3 = splitvars(T1,["BMI_Data" "BloodPressure"])
T3=100×6 table
     LastName     Personal_Data    Height    Weight    Systolic    Diastolic
    __________    _____________    ______    ______    ________    _________

                  Age    Smoker
                  ___    ______

    "Smith"       38     true        71       176        124          93
    "Johnson"     43     false       69       163        109          77
    "Williams"    38     false       64       131        125          83
    "Jones"       40     false       67       133        117          75
    "Brown"       49     false       64       119        122          80
    "Davis"       46     false       68       142        121          70
    "Miller"      33     true        64       142        130          88
    "Wilson"      40     false       68       180        115          82
    "Moore"       28     false       68       183        115          78
    "Taylor"      31     false       66       132        118          86
    "Anderson"    45     false       68       128        114          77
    "Thomas"      42     false       66       137        115          68
    "Jackson"     25     false       71       174        127          74
    "White"       39     true        72       202        130          95
    "Harris"      36     false       65       129        114          79
    "Martin"      48     true        71       181        130          92
      ⋮
To specify variables by position, use a numeric array.
T4 = splitvars(T1,[2 4])
T4=100×6 table
     LastName     Age    Smoker        BMI_Data        Systolic    Diastolic
    __________    ___    ______    ________________    ________    _________

                                   Height    Weight
                                   ______    ______

    "Smith"       38     true        71       176        124          93
    "Johnson"     43     false       69       163        109          77
    "Williams"    38     false       64       131        125          83
    "Jones"       40     false       67       133        117          75
    "Brown"       49     false       64       119        122          80
    "Davis"       46     false       68       142        121          70
    "Miller"      33     true        64       142        130          88
    "Wilson"      40     false       68       180        115          82
    "Moore"       28     false       68       183        115          78
    "Taylor"      31     false       66       132        118          86
    "Anderson"    45     false       68       128        114          77
    "Thomas"      42     false       66       137        115          68
    "Jackson"     25     false       71       174        127          74
    "White"       39     true        72       202        130          95
    "Harris"      36     false       65       129        114          79
    "Martin"      48     true        71       181        130          92
      ⋮
Create a table that contains multi-column variables, using data from the patients.mat file.
load patients
Personal_Data = [Age,Height,Weight];
BloodPressure = [Systolic,Diastolic];
T1 = table(LastName,Smoker,Personal_Data,BloodPressure)T1=100×4 table
LastName Smoker Personal_Data BloodPressure
____________ ______ ________________ _____________
{'Smith' } true 38 71 176 124 93
{'Johnson' } false 43 69 163 109 77
{'Williams'} false 38 64 131 125 83
{'Jones' } false 40 67 133 117 75
{'Brown' } false 49 64 119 122 80
{'Davis' } false 46 68 142 121 70
{'Miller' } true 33 64 142 130 88
{'Wilson' } false 40 68 180 115 82
{'Moore' } false 28 68 183 115 78
{'Taylor' } false 31 66 132 118 86
{'Anderson'} false 45 68 128 114 77
{'Thomas' } false 42 66 137 115 68
{'Jackson' } false 25 71 174 127 74
{'White' } true 39 72 202 130 95
{'Harris' } false 36 65 129 114 79
{'Martin' } true 48 71 181 130 92
⋮
Split BloodPressure and specify new names for the new variables in the output table.
T2 = splitvars(T1,"BloodPressure",NewVariableNames=["Systolic" "Diastolic"])
T2=100×5 table
      LastName      Smoker     Personal_Data      Systolic    Diastolic
    ____________    ______    ________________    ________    _________

    {'Smith'   }    true      38     71    176      124          93
    {'Johnson' }    false     43     69    163      109          77
    {'Williams'}    false     38     64    131      125          83
    {'Jones'   }    false     40     67    133      117          75
    {'Brown'   }    false     49     64    119      122          80
    {'Davis'   }    false     46     68    142      121          70
    {'Miller'  }    true      33     64    142      130          88
    {'Wilson'  }    false     40     68    180      115          82
    {'Moore'   }    false     28     68    183      115          78
    {'Taylor'  }    false     31     66    132      118          86
    {'Anderson'}    false     45     68    128      114          77
    {'Thomas'  }    false     42     66    137      115          68
    {'Jackson' }    false     25     71    174      127          74
    {'White'   }    true      39     72    202      130          95
    {'Harris'  }    false     36     65    129      114          79
    {'Martin'  }    true      48     71    181      130          92
      ⋮
Split both BMI_Data and BloodPressure. For each variable being split, you must provide a cell array with the correct number of new names.
T3 = splitvars(T1,["Personal_Data" "BloodPressure"], ...
     NewVariableNames={["Age" "Height" "Weight"] ["Systolic" "Diastolic"]})
T3=100×7 table
      LastName      Smoker    Age    Height    Weight    Systolic    Diastolic
    ____________    ______    ___    ______    ______    ________    _________

    {'Smith'   }    true      38       71       176        124          93
    {'Johnson' }    false     43       69       163        109          77
    {'Williams'}    false     38       64       131        125          83
    {'Jones'   }    false     40       67       133        117          75
    {'Brown'   }    false     49       64       119        122          80
    {'Davis'   }    false     46       68       142        121          70
    {'Miller'  }    true      33       64       142        130          88
    {'Wilson'  }    false     40       68       180        115          82
    {'Moore'   }    false     28       68       183        115          78
    {'Taylor'  }    false     31       66       132        118          86
    {'Anderson'}    false     45       68       128        114          77
    {'Thomas'  }    false     42       66       137        115          68
    {'Jackson' }    false     25       71       174        127          74
    {'White'   }    true      39       72       202        130          95
    {'Harris'  }    false     36       65       129        114          79
    {'Martin'  }    true      48       71       181        130          92
      ⋮
Input Arguments
Input table, specified as a table or timetable.
Variables in the input table, specified as a string array, character
vector, cell array of character vectors, pattern scalar, numeric array, or logical array.
Names of the split variables, specified as a string array or cell array of character vectors.
Output Arguments
Output table with split variables, returned as a table or timetable.
Extended Capabilities
The
splitvars function fully supports tall arrays. For more information,
see Tall Arrays.
Usage notes and limitations:
The
varsinput argument does not support pattern expressions.The value of the
NewVariableNamesname-value argument must be constant.The variables that are split cannot have a variable number of columns.
Refer to the usage notes and limitations in the C/C++ Code Generation section. The same usage notes and limitations apply to GPU code generation.
The splitvars function fully supports
thread-based environments. For more information, see Run MATLAB Functions in Thread-Based Environment.
Version History
Introduced in R2018a
MATLAB Command
You clicked a link that corresponds to this MATLAB command:
Run the command by entering it in the MATLAB Command Window. Web browsers do not support MATLAB commands.
Select a Web Site
Choose a web site to get translated content where available and see local events and offers. Based on your location, we recommend that you select: .
You can also select a web site from the following list
How to Get Best Site Performance
Select the China site (in Chinese or English) for best site performance. Other MathWorks country sites are not optimized for visits from your location.
Americas
- América Latina (Español)
- Canada (English)
- United States (English)
Europe
- Belgium (English)
- Denmark (English)
- Deutschland (Deutsch)
- España (Español)
- Finland (English)
- France (Français)
- Ireland (English)
- Italia (Italiano)
- Luxembourg (English)
- Netherlands (English)
- Norway (English)
- Österreich (Deutsch)
- Portugal (English)
- Sweden (English)
- Switzerland
- United Kingdom (English)