movevars
Move variables in table or timetable
Syntax
Description
T2 = movevars(T1,vars)
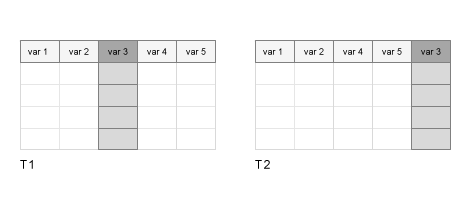
For example, to move a table variable named var3 to the end of
T1, use T2 = movevars(T1,'var3'). If the
last variable of T1 is named var5, then this
syntax moves var3 to the right of var5.
T2 = movevars(T1,vars,After=location)location. You can specify variables and
location by name, by position, or by an array of logical
indices. The variable specified by location can be any variable
in the input table.
For example, to move a table variable named var3 after table
variable var5, use T2 =
movevars(T1,"var3",After="var5").
Before R2023a: If you do not know the name or position of the last variable, you can move
varsto the end of the table by using the syntaxT2 = movevars(T1,vars,After=width(T1)). Thewidthfunction returns the number of variables in a table.
Examples
Create a table and move variables one at a time. You can specify variables by name or by position in the table.
Read data from a spreadsheet into a table.
T1 = readtable("outages.csv",TextType="string")
T1=1468×6 table
      Region          OutageTime        Loss     Customers     RestorationTime           Cause
    ___________    ________________    ______    __________    ________________    _________________

    "SouthWest"    2002-02-01 12:18    458.98    1.8202e+06    2002-02-07 16:50    "winter storm"
    "SouthEast"    2003-01-23 00:49    530.14    2.1204e+05                 NaT    "winter storm"
    "SouthEast"    2003-02-07 21:15     289.4    1.4294e+05    2003-02-17 08:14    "winter storm"
    "West"         2004-04-06 05:44    434.81    3.4037e+05    2004-04-06 06:10    "equipment fault"
    "MidWest"      2002-03-16 06:18    186.44    2.1275e+05    2002-03-18 23:23    "severe storm"
    "West"         2003-06-18 02:49         0             0    2003-06-18 10:54    "attack"
    "West"         2004-06-20 14:39    231.29           NaN    2004-06-20 19:16    "equipment fault"
    "West"         2002-06-06 19:28    311.86           NaN    2002-06-07 00:51    "equipment fault"
    "NorthEast"    2003-07-16 16:23    239.93         49434    2003-07-17 01:12    "fire"
    "MidWest"      2004-09-27 11:09    286.72         66104    2004-09-27 16:37    "equipment fault"
    "SouthEast"    2004-09-05 17:48    73.387         36073    2004-09-05 20:46    "equipment fault"
    "West"         2004-05-21 21:45    159.99           NaN    2004-05-22 04:23    "equipment fault"
    "SouthEast"    2002-09-01 18:22    95.917         36759    2002-09-01 19:12    "severe storm"
    "SouthEast"    2003-09-27 07:32       NaN    3.5517e+05    2003-10-04 07:02    "severe storm"
    "West"         2003-11-12 06:12    254.09    9.2429e+05    2003-11-17 02:04    "winter storm"
    "NorthEast"    2004-09-18 05:54         0             0                 NaT    "equipment fault"
      ⋮
Move the variable that is named Region so that it is before the variable named Cause.
T2 = movevars(T1,"Region",Before="Cause")
T2=1468×6 table
       OutageTime        Loss     Customers     RestorationTime       Region             Cause
    ________________    ______    __________    ________________    ___________    _________________

    2002-02-01 12:18    458.98    1.8202e+06    2002-02-07 16:50    "SouthWest"    "winter storm"
    2003-01-23 00:49    530.14    2.1204e+05                 NaT    "SouthEast"    "winter storm"
    2003-02-07 21:15     289.4    1.4294e+05    2003-02-17 08:14    "SouthEast"    "winter storm"
    2004-04-06 05:44    434.81    3.4037e+05    2004-04-06 06:10    "West"         "equipment fault"
    2002-03-16 06:18    186.44    2.1275e+05    2002-03-18 23:23    "MidWest"      "severe storm"
    2003-06-18 02:49         0             0    2003-06-18 10:54    "West"         "attack"
    2004-06-20 14:39    231.29           NaN    2004-06-20 19:16    "West"         "equipment fault"
    2002-06-06 19:28    311.86           NaN    2002-06-07 00:51    "West"         "equipment fault"
    2003-07-16 16:23    239.93         49434    2003-07-17 01:12    "NorthEast"    "fire"
    2004-09-27 11:09    286.72         66104    2004-09-27 16:37    "MidWest"      "equipment fault"
    2004-09-05 17:48    73.387         36073    2004-09-05 20:46    "SouthEast"    "equipment fault"
    2004-05-21 21:45    159.99           NaN    2004-05-22 04:23    "West"         "equipment fault"
    2002-09-01 18:22    95.917         36759    2002-09-01 19:12    "SouthEast"    "severe storm"
    2003-09-27 07:32       NaN    3.5517e+05    2003-10-04 07:02    "SouthEast"    "severe storm"
    2003-11-12 06:12    254.09    9.2429e+05    2003-11-17 02:04    "West"         "winter storm"
    2004-09-18 05:54         0             0                 NaT    "NorthEast"    "equipment fault"
      ⋮
Move the fourth variable so that it is after the first variable.
T3 = movevars(T2,4,After=1)
T3=1468×6 table
       OutageTime       RestorationTime      Loss     Customers       Region             Cause
    ________________    ________________    ______    __________    ___________    _________________

    2002-02-01 12:18    2002-02-07 16:50    458.98    1.8202e+06    "SouthWest"    "winter storm"
    2003-01-23 00:49                 NaT    530.14    2.1204e+05    "SouthEast"    "winter storm"
    2003-02-07 21:15    2003-02-17 08:14     289.4    1.4294e+05    "SouthEast"    "winter storm"
    2004-04-06 05:44    2004-04-06 06:10    434.81    3.4037e+05    "West"         "equipment fault"
    2002-03-16 06:18    2002-03-18 23:23    186.44    2.1275e+05    "MidWest"      "severe storm"
    2003-06-18 02:49    2003-06-18 10:54         0             0    "West"         "attack"
    2004-06-20 14:39    2004-06-20 19:16    231.29           NaN    "West"         "equipment fault"
    2002-06-06 19:28    2002-06-07 00:51    311.86           NaN    "West"         "equipment fault"
    2003-07-16 16:23    2003-07-17 01:12    239.93         49434    "NorthEast"    "fire"
    2004-09-27 11:09    2004-09-27 16:37    286.72         66104    "MidWest"      "equipment fault"
    2004-09-05 17:48    2004-09-05 20:46    73.387         36073    "SouthEast"    "equipment fault"
    2004-05-21 21:45    2004-05-22 04:23    159.99           NaN    "West"         "equipment fault"
    2002-09-01 18:22    2002-09-01 19:12    95.917         36759    "SouthEast"    "severe storm"
    2003-09-27 07:32    2003-10-04 07:02       NaN    3.5517e+05    "SouthEast"    "severe storm"
    2003-11-12 06:12    2003-11-17 02:04    254.09    9.2429e+05    "West"         "winter storm"
    2004-09-18 05:54                 NaT         0             0    "NorthEast"    "equipment fault"
      ⋮
Move multiple table variables using the movevars function. You can specify variables by name or by position.
Read data from a spreadsheet into a table.
T1 = readtable("outages.csv",TextType="string")
T1=1468×6 table
      Region          OutageTime        Loss     Customers     RestorationTime           Cause
    ___________    ________________    ______    __________    ________________    _________________

    "SouthWest"    2002-02-01 12:18    458.98    1.8202e+06    2002-02-07 16:50    "winter storm"
    "SouthEast"    2003-01-23 00:49    530.14    2.1204e+05                 NaT    "winter storm"
    "SouthEast"    2003-02-07 21:15     289.4    1.4294e+05    2003-02-17 08:14    "winter storm"
    "West"         2004-04-06 05:44    434.81    3.4037e+05    2004-04-06 06:10    "equipment fault"
    "MidWest"      2002-03-16 06:18    186.44    2.1275e+05    2002-03-18 23:23    "severe storm"
    "West"         2003-06-18 02:49         0             0    2003-06-18 10:54    "attack"
    "West"         2004-06-20 14:39    231.29           NaN    2004-06-20 19:16    "equipment fault"
    "West"         2002-06-06 19:28    311.86           NaN    2002-06-07 00:51    "equipment fault"
    "NorthEast"    2003-07-16 16:23    239.93         49434    2003-07-17 01:12    "fire"
    "MidWest"      2004-09-27 11:09    286.72         66104    2004-09-27 16:37    "equipment fault"
    "SouthEast"    2004-09-05 17:48    73.387         36073    2004-09-05 20:46    "equipment fault"
    "West"         2004-05-21 21:45    159.99           NaN    2004-05-22 04:23    "equipment fault"
    "SouthEast"    2002-09-01 18:22    95.917         36759    2002-09-01 19:12    "severe storm"
    "SouthEast"    2003-09-27 07:32       NaN    3.5517e+05    2003-10-04 07:02    "severe storm"
    "West"         2003-11-12 06:12    254.09    9.2429e+05    2003-11-17 02:04    "winter storm"
    "NorthEast"    2004-09-18 05:54         0             0                 NaT    "equipment fault"
      ⋮
Move the variables named Loss, Customer, and Cause so that they are before the first variable.
T2 = movevars(T1,["Loss" "Customers" "Cause"],Before=1)
T2=1468×6 table
     Loss     Customers           Cause            Region          OutageTime       RestorationTime
    ______    __________    _________________    ___________    ________________    ________________

    458.98    1.8202e+06    "winter storm"       "SouthWest"    2002-02-01 12:18    2002-02-07 16:50
    530.14    2.1204e+05    "winter storm"       "SouthEast"    2003-01-23 00:49                 NaT
     289.4    1.4294e+05    "winter storm"       "SouthEast"    2003-02-07 21:15    2003-02-17 08:14
    434.81    3.4037e+05    "equipment fault"    "West"         2004-04-06 05:44    2004-04-06 06:10
    186.44    2.1275e+05    "severe storm"       "MidWest"      2002-03-16 06:18    2002-03-18 23:23
         0             0    "attack"             "West"         2003-06-18 02:49    2003-06-18 10:54
    231.29           NaN    "equipment fault"    "West"         2004-06-20 14:39    2004-06-20 19:16
    311.86           NaN    "equipment fault"    "West"         2002-06-06 19:28    2002-06-07 00:51
    239.93         49434    "fire"               "NorthEast"    2003-07-16 16:23    2003-07-17 01:12
    286.72         66104    "equipment fault"    "MidWest"      2004-09-27 11:09    2004-09-27 16:37
    73.387         36073    "equipment fault"    "SouthEast"    2004-09-05 17:48    2004-09-05 20:46
    159.99           NaN    "equipment fault"    "West"         2004-05-21 21:45    2004-05-22 04:23
    95.917         36759    "severe storm"       "SouthEast"    2002-09-01 18:22    2002-09-01 19:12
       NaN    3.5517e+05    "severe storm"       "SouthEast"    2003-09-27 07:32    2003-10-04 07:02
    254.09    9.2429e+05    "winter storm"       "West"         2003-11-12 06:12    2003-11-17 02:04
         0             0    "equipment fault"    "NorthEast"    2004-09-18 05:54                 NaT
      ⋮
Move the first four variables of T2 so that they are after RestorationTime.
T3 = movevars(T2,[1:4],After="RestorationTime")T3=1468×6 table
OutageTime RestorationTime Loss Customers Cause Region
________________ ________________ ______ __________ _________________ ___________
2002-02-01 12:18 2002-02-07 16:50 458.98 1.8202e+06 "winter storm" "SouthWest"
2003-01-23 00:49 NaT 530.14 2.1204e+05 "winter storm" "SouthEast"
2003-02-07 21:15 2003-02-17 08:14 289.4 1.4294e+05 "winter storm" "SouthEast"
2004-04-06 05:44 2004-04-06 06:10 434.81 3.4037e+05 "equipment fault" "West"
2002-03-16 06:18 2002-03-18 23:23 186.44 2.1275e+05 "severe storm" "MidWest"
2003-06-18 02:49 2003-06-18 10:54 0 0 "attack" "West"
2004-06-20 14:39 2004-06-20 19:16 231.29 NaN "equipment fault" "West"
2002-06-06 19:28 2002-06-07 00:51 311.86 NaN "equipment fault" "West"
2003-07-16 16:23 2003-07-17 01:12 239.93 49434 "fire" "NorthEast"
2004-09-27 11:09 2004-09-27 16:37 286.72 66104 "equipment fault" "MidWest"
2004-09-05 17:48 2004-09-05 20:46 73.387 36073 "equipment fault" "SouthEast"
2004-05-21 21:45 2004-05-22 04:23 159.99 NaN "equipment fault" "West"
2002-09-01 18:22 2002-09-01 19:12 95.917 36759 "severe storm" "SouthEast"
2003-09-27 07:32 2003-10-04 07:02 NaN 3.5517e+05 "severe storm" "SouthEast"
2003-11-12 06:12 2003-11-17 02:04 254.09 9.2429e+05 "winter storm" "West"
2004-09-18 05:54 NaT 0 0 "equipment fault" "NorthEast"
⋮
Input Arguments
Input table, specified as a table or timetable.
Variables in the input table, specified as a string array, character
vector, cell array of character vectors, pattern scalar, numeric array, or logical array.
Location to insert moved variables, specified as a string scalar, character vector, integer, or logical array.
If
locationis a string scalar or character vector, then it is the name of a variable in the input tableT1.If
locationis the integern, then it specifies thenth variable inT1.If
locationis a logical array, whosenth element is1(true), then it specifies thenth variable inT1. All other elements oflocationmust be0(false).
Output Arguments
Output table with moved variables, returned as a table or timetable.
Extended Capabilities
The
movevars function fully supports tall arrays. For more information,
see Tall Arrays.
Usage notes and limitations:
The
varsinput argument cannot contain duplicate variable names.The
varsinput argument does not support pattern expressions.
For more information, see Code Generation for Tables (MATLAB Coder) and Table Limitations for Code Generation (MATLAB Coder).
Refer to the usage notes and limitations in the C/C++ Code Generation section. The same usage notes and limitations apply to GPU code generation.
The movevars function fully supports
thread-based environments. For more information, see Run MATLAB Functions in Thread-Based Environment.
The movevars function fully supports
distributed arrays. For more information, see Run MATLAB Functions with Distributed Arrays (Parallel Computing Toolbox).
Version History
Introduced in R2018aYou can now move variables after the last variable without specifying the
After name-value argument. In previous releases, calling
movevars without specifying either the
After or Before name-value argument
resulted in an error.
MATLAB Command
You clicked a link that corresponds to this MATLAB command:
Run the command by entering it in the MATLAB Command Window. Web browsers do not support MATLAB commands.
Select a Web Site
Choose a web site to get translated content where available and see local events and offers. Based on your location, we recommend that you select: .
You can also select a web site from the following list
How to Get Best Site Performance
Select the China site (in Chinese or English) for best site performance. Other MathWorks country sites are not optimized for visits from your location.
Americas
- América Latina (Español)
- Canada (English)
- United States (English)
Europe
- Belgium (English)
- Denmark (English)
- Deutschland (Deutsch)
- España (Español)
- Finland (English)
- France (Français)
- Ireland (English)
- Italia (Italiano)
- Luxembourg (English)
- Netherlands (English)
- Norway (English)
- Österreich (Deutsch)
- Portugal (English)
- Sweden (English)
- Switzerland
- United Kingdom (English)