Main Content

poisolv

(Not recommended) Fast solver for Poisson's equation on rectangular grid

poisolv is not recommended. To solve Poisson's equations, use solvepde. For details, see Solve Problems Using PDEModel Objects.

Description

u = poisolv(model,p,e,t,f) solves a Poisson's equation Δu=f on a regular rectangular [p,e,t] mesh. The model must have only Dirichlet boundary conditions. A combination of sine transforms and tridiagonal solutions is used for increased performance.

example

u = poisolv(b,p,e,t,f) solves a Poisson's equation with Dirichlet boundary conditions u = b on a regular rectangular [p,e,t] mesh.

Examples

collapse all

Solve the Poisson's equation -Δu=3x2 on a square domain with Dirichlet boundary conditions using the poisolv function.

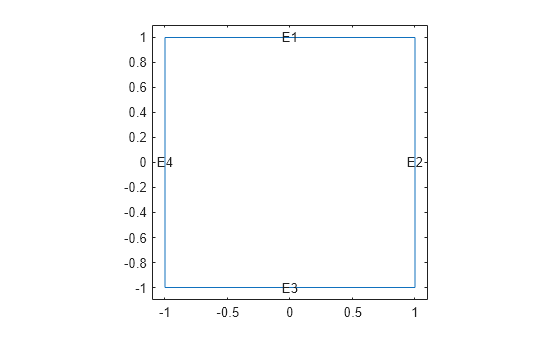
Create a model object and include the square geometry created using the squareg function.

model = createpde;
g = @squareg;
geometryFromEdges(model,g);

Plot the geometry with the edge labels.

pdegplot(model,"EdgeLabels","on")
axis([-1.1 1.1 -1.1 1.1])

Figure contains an axes object. The axes object contains 5 objects of type line, text.

Apply the following Dirichlet boundary conditions. The solution is 0.2cos(πy/2) on the right boundary (edge 2) and zero on all other boundaries.

innerBC = @(region,state) 0.2*cos(pi/2*region.y);
applyBoundaryCondition(model,"Dirichlet","Edge",2,"u",innerBC);
applyBoundaryCondition(model,"Dirichlet","Edge",[1 3 4],"u",0);

The fast Poisson solver requires a regular rectangular grid. Use the poimesh function to generate a mesh meeting this requirement. Plot the mesh.

[p,e,t] = poimesh(g,16);
figure; 
pdemesh(p,e,t); 
axis equal

Figure contains an axes object. The axes object contains 2 objects of type line.

Specify the PDE coefficients.

c = 1;
a = 0;
f = '3*x.^2';

Solve the equation on different meshes using the poisolv function.

for n = [16 32 64 128 256 512]
    [p,e,t] = poimesh(g,n);
    tic;
      u = poisolv(model,p,e,t,f);
    tfast = toc;
    fprintf('%-5d|%15.5g\n',n,tfast);
end
16   |         0.3334
32   |       0.059799
64   |       0.045932
128  |       0.045877
256  |        0.21496
512  |        0.38376

Plot the solution on the finest mesh.

figure;
pdeplot(p,[],t,"XYData",u,"ZData",u)

Figure contains an axes object. The axes object contains an object of type patch.

Input Arguments

collapse all

PDE model, specified as a PDEModel object.

Example: model = createpde

Dirichlet boundary conditions for all boundary points, specified as a boundary matrix or boundary file. Pass a boundary file as a function handle or as a file name. A boundary matrix is generally an export from the PDE Modeler app.

Example: b = 'circleb1', b = "circleb1", or b = @circleb1

Data Types: double | char | string | function_handle

Mesh points, specified as a 2-by-Np matrix of points, where Np is the number of points in the mesh. For details on the mesh data representation, see initmesh.

Data Types: double

Mesh edges, specified as a 7-by-Ne matrix of edges, where Ne is the number of edges in the mesh. For details on the mesh data representation, see initmesh.

Data Types: double

Mesh triangles, specified as a 4-by-Nt matrix of triangles, where Nt is the number of triangles in the mesh. For details on the mesh data representation, see initmesh.

Data Types: double

Right side of a Poisson's equation, specified as a scalar, matrix, character vector, character array, string scalar, string vector, or coefficient function.

Data Types: double | char | string | function_handle

Output Arguments

collapse all

PDE solution, returned as a vector.

References

[1] Strang, G. Introduction to Applied Mathematics. Wellesley-Cambridge Press, Cambridge, MA, 1986, pp. 453–458.

Version History

Introduced before R2006a

collapse all