MATLAB Help Center
Plot RF chain cascaded analysis results
plot(obj)
h = plot(obj)
plot(obj) displays a plot of the cascaded gain, noise figure, OIP3 and IIP3 values of the RF chain object obj.
obj
example
h = plot(obj) returns a column vector of line series handles, where h contains one handle per plotted line.
h
collapse all
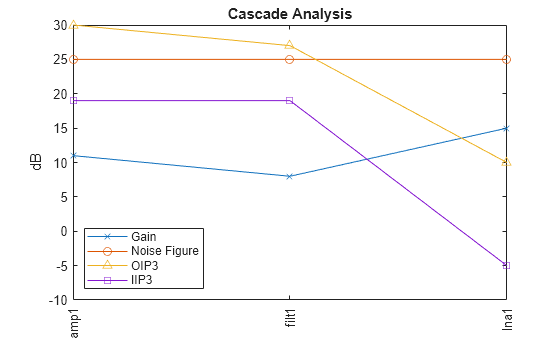
Assign stage-by-stage values of gain, noise figure, OIP3 and stage names.
g = [11 -3 7]; nf = [25 3 5]; oip3 = [30 Inf 10]; nm = {'amp1','filt1','lna1'};
Create an RF chain object.
rfch = rfchain(g,nf,oip3,'Name',nm);
Plot the results.
plot(rfch)
rfchain
RF chain object, specified as an rfchain object.
Line series handle, returned as a column vector, that contains one handle per plotted line.
Introduced in R2014b
rfchain.setstage | rfchain.worksheet | rfchain.cumoip3 | rfchain.cumoip3 | rfchain.cumiip3 | rfchain.cumgain
rfchain.setstage
rfchain.worksheet
rfchain.cumoip3
rfchain.cumiip3
rfchain.cumgain
You clicked a link that corresponds to this MATLAB command:
Run the command by entering it in the MATLAB Command Window. Web browsers do not support MATLAB commands.
Select a Web Site
Choose a web site to get translated content where available and see local events and offers. Based on your location, we recommend that you select: .
You can also select a web site from the following list
How to Get Best Site Performance
Select the China site (in Chinese or English) for best site performance. Other MathWorks country sites are not optimized for visits from your location.
Americas
Europe
Asia Pacific
Contact your local office