Main Content

summary

Return parameter estimates and fit quality statistics from SimBiology nonlinear mixed-effects estimation

Since R2026a

Description

fitMetrics = summary(resultsObj) returns a structure array fitMetrics that contains tables of estimated values and fit quality statistics from nonlinear mixed-effects estimation.

example

Examples

collapse all

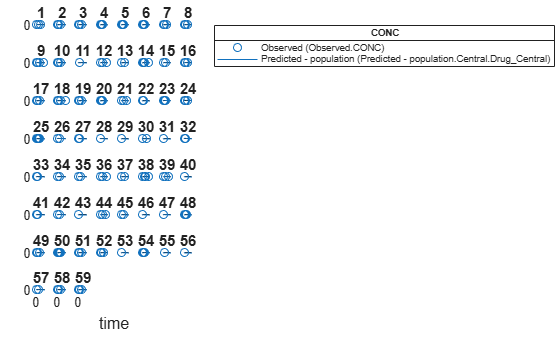
This example uses data collected on 59 preterm infants given phenobarbital during the first 16 days after birth [1]. Each infant received an initial dose followed by one or more sustaining doses by intravenous bolus administration. A total of between 1 and 6 concentration measurements were obtained from each infant at times other than dose times, for a total of 155 measurements. Infant weights and APGAR scores (a measure of newborn health) were also recorded.

Load the data.

load pheno.mat ds

Convert the dataset to a groupedData object, a container for holding tabular data that is divided into groups. It can automatically identify commonly used variable names as the grouping variable or independent (time) variable. Display the properties of the data and confirm that GroupVariableName and IndependentVariableName are correctly identified as 'ID' and 'TIME', respectively.

data = groupedData(ds);
data.Properties
ans = struct with fields:
                Description: ''
                   UserData: []
             DimensionNames: {'Observations'  'Variables'}
              VariableNames: {'ID'  'TIME'  'DOSE'  'WEIGHT'  'APGAR'  'CONC'}
              VariableTypes: ["double"    "double"    "double"    "double"    "double"    "double"]
       VariableDescriptions: {}
              VariableUnits: {}
         VariableContinuity: []
                   RowNames: {}
           CustomProperties: [1×1 matlab.tabular.CustomProperties]
          GroupVariableName: 'ID'
    IndependentVariableName: 'TIME'

Create a simple one-compartment PK model with bolus dosing and linear clearance to fit such data. Use the PKModelDesign object to construct the model. Each compartment is defined by a name, dosing type, a clearance type, and whether or not the dosing requires a lag parameter. After constructing the model, you can also get a PKModelMap object map that lists the names of species and parameters in the model that are most relevant for fitting.

pkmd = PKModelDesign;
addCompartment(pkmd,'Central','DosingType','Bolus',...
                    'EliminationType','linear-clearance',...
                    'HasResponseVariable',true,'HasLag',false);
[onecomp, map] = pkmd.construct;

Describe the experimentally measured response by mapping the appropriate model component to the response variable. In other words, indicate which species in the model corresponds to which response variable in the data. The PKModelMap property Observed indicates that the relevant species in the model is Drug_Central, which represents the drug concentration in the system. The relevant data variable is CONC, which you visualized previously.

map.Observed
ans = 1×1 cell array
    {'Drug_Central'}

Map the Drug_Central species to the CONC variable.

responseMap = 'Drug_Central = CONC';

The parameters to estimate in this model are the volume of the central compartment Central and the clearance rate Cl_Central. The PKModelMap property Estimated lists these relevant parameters. The underlying algorithm of sbiofitmixed assumes parameters are normally distributed, but this assumption may not be true for biological parameters that are constrained to be positive, such as volume and clearance. Specify a log transform for the estimated parameters so that the transformed parameters follow a normal distribution. Use an estimatedInfo object to define such transforms and initial values (optional).

map.Estimated
ans = 2×1 cell
    {'Central'   }
    {'Cl_Central'}

Define such estimated parameters, appropriate transformations, and initial values.

estimatedParams = estimatedInfo({'log(Central)','log(Cl_Central)'},'InitialValue',[1 1]);

Each infant received a different schedule of dosing. The amount of drug is listed in the data variable DOSE. To specify this dosing during fitting, create dose objects from the data. These objects use the property TargetName to specify which species in the model receives the dose. In this example, the target species is Drug_Central, as listed by the PKModelMap property Dosed.

map.Dosed
ans = 1×1 cell array
    {'Drug_Central'}

Create a sample dose with this target name and then use the createDoses method of groupedData object data to generate doses for each infant based on the dosing data DOSE.

sampleDose = sbiodose('sample','TargetName','Drug_Central');
doses = createDoses(data,'DOSE','',sampleDose);

Fit the model.

[nlmeResults,simI,simP] = sbiofitmixed(onecomp,data,responseMap,estimatedParams,doses,'nlmefit');

Visualize the fitted results using individual-specific parameter estimates.

plot(nlmeResults,'ParameterType','individual');

Figure contains 60 axes objects. Axes object 1 with title 59 contains 2 objects of type line. One or more of the lines displays its values using only markers Axes object 2 with title 58 contains 2 objects of type line. One or more of the lines displays its values using only markers Axes object 3 with title 57 contains 2 objects of type line. One or more of the lines displays its values using only markers Axes object 4 with title 56 contains 2 objects of type line. One or more of the lines displays its values using only markers Axes object 5 with title 55 contains 2 objects of type line. One or more of the lines displays its values using only markers Axes object 6 with title 54 contains 2 objects of type line. One or more of the lines displays its values using only markers Axes object 7 with title 53 contains 2 objects of type line. One or more of the lines displays its values using only markers Axes object 8 with title 52 contains 2 objects of type line. One or more of the lines displays its values using only markers Axes object 9 with title 51 contains 2 objects of type line. One or more of the lines displays its values using only markers Axes object 10 with title 50 contains 2 objects of type line. One or more of the lines displays its values using only markers Axes object 11 with title 49 contains 2 objects of type line. One or more of the lines displays its values using only markers Axes object 12 with title 48 contains 2 objects of type line. One or more of the lines displays its values using only markers Axes object 13 with title 47 contains 2 objects of type line. One or more of the lines displays its values using only markers Axes object 14 with title 46 contains 2 objects of type line. One or more of the lines displays its values using only markers Axes object 15 with title 45 contains 2 objects of type line. One or more of the lines displays its values using only markers Axes object 16 with title 44 contains 2 objects of type line. One or more of the lines displays its values using only markers Axes object 17 with title 43 contains 2 objects of type line. One or more of the lines displays its values using only markers Axes object 18 with title 42 contains 2 objects of type line. One or more of the lines displays its values using only markers Axes object 19 with title 41 contains 2 objects of type line. One or more of the lines displays its values using only markers Axes object 20 with title 40 contains 2 objects of type line. One or more of the lines displays its values using only markers Axes object 21 with title 39 contains 2 objects of type line. One or more of the lines displays its values using only markers Axes object 22 with title 38 contains 2 objects of type line. One or more of the lines displays its values using only markers Axes object 23 with title 37 contains 2 objects of type line. One or more of the lines displays its values using only markers Axes object 24 with title 36 contains 2 objects of type line. One or more of the lines displays its values using only markers Axes object 25 with title 35 contains 2 objects of type line. One or more of the lines displays its values using only markers Axes object 26 with title 34 contains 2 objects of type line. One or more of the lines displays its values using only markers Axes object 27 with title 33 contains 2 objects of type line. One or more of the lines displays its values using only markers Axes object 28 with title 32 contains 2 objects of type line. One or more of the lines displays its values using only markers Axes object 29 with title 31 contains 2 objects of type line. One or more of the lines displays its values using only markers Axes object 30 with title 30 contains 2 objects of type line. One or more of the lines displays its values using only markers Axes object 31 with title 29 contains 2 objects of type line. One or more of the lines displays its values using only markers Axes object 32 with title 28 contains 2 objects of type line. One or more of the lines displays its values using only markers Axes object 33 with title 27 contains 2 objects of type line. One or more of the lines displays its values using only markers Axes object 34 with title 26 contains 2 objects of type line. One or more of the lines displays its values using only markers Axes object 35 with title 25 contains 2 objects of type line. One or more of the lines displays its values using only markers Axes object 36 with title 24 contains 2 objects of type line. One or more of the lines displays its values using only markers Axes object 37 with title 23 contains 2 objects of type line. One or more of the lines displays its values using only markers Axes object 38 with title 22 contains 2 objects of type line. One or more of the lines displays its values using only markers Axes object 39 with title 21 contains 2 objects of type line. One or more of the lines displays its values using only markers Axes object 40 with title 20 contains 2 objects of type line. One or more of the lines displays its values using only markers Axes object 41 with title 19 contains 2 objects of type line. One or more of the lines displays its values using only markers Axes object 42 with title 18 contains 2 objects of type line. One or more of the lines displays its values using only markers Axes object 43 with title 17 contains 2 objects of type line. One or more of the lines displays its values using only markers Axes object 44 with title 16 contains 2 objects of type line. One or more of the lines displays its values using only markers Axes object 45 with title 15 contains 2 objects of type line. One or more of the lines displays its values using only markers Axes object 46 with title 14 contains 2 objects of type line. One or more of the lines displays its values using only markers Axes object 47 with title 13 contains 2 objects of type line. One or more of the lines displays its values using only markers Axes object 48 with title 12 contains 2 objects of type line. One or more of the lines displays its values using only markers Axes object 49 with title 11 contains 2 objects of type line. One or more of the lines displays its values using only markers Axes object 50 with title 10 contains 2 objects of type line. One or more of the lines displays its values using only markers Axes object 51 with title 9 contains 2 objects of type line. One or more of the lines displays its values using only markers Axes object 52 with title 8 contains 2 objects of type line. One or more of the lines displays its values using only markers Axes object 53 with title 7 contains 2 objects of type line. One or more of the lines displays its values using only markers Axes object 54 with title 6 contains 2 objects of type line. One or more of the lines displays its values using only markers Axes object 55 with title 5 contains 2 objects of type line. One or more of the lines displays its values using only markers Axes object 56 with title 4 contains 2 objects of type line. One or more of the lines displays its values using only markers Axes object 57 with title 3 contains 2 objects of type line. One or more of the lines displays its values using only markers Axes object 58 with title 2 contains 2 objects of type line. One or more of the lines displays its values using only markers Axes object 59 with title 1 contains 2 objects of type line. One or more of the lines displays its values using only markers Hidden axes object 60 contains 2 objects of type line. One or more of the lines displays its values using only markers These objects represent Predicted - individual (Predicted - individual.Central.Drug_Central), Observed (Observed.CONC).

Visualize the fitted results using population parameter estimates.

plot(nlmeResults,'ParameterType','population');

Figure contains 60 axes objects. Axes object 1 with title 59 contains 2 objects of type line. One or more of the lines displays its values using only markers Axes object 2 with title 58 contains 2 objects of type line. One or more of the lines displays its values using only markers Axes object 3 with title 57 contains 2 objects of type line. One or more of the lines displays its values using only markers Axes object 4 with title 56 contains 2 objects of type line. One or more of the lines displays its values using only markers Axes object 5 with title 55 contains 2 objects of type line. One or more of the lines displays its values using only markers Axes object 6 with title 54 contains 2 objects of type line. One or more of the lines displays its values using only markers Axes object 7 with title 53 contains 2 objects of type line. One or more of the lines displays its values using only markers Axes object 8 with title 52 contains 2 objects of type line. One or more of the lines displays its values using only markers Axes object 9 with title 51 contains 2 objects of type line. One or more of the lines displays its values using only markers Axes object 10 with title 50 contains 2 objects of type line. One or more of the lines displays its values using only markers Axes object 11 with title 49 contains 2 objects of type line. One or more of the lines displays its values using only markers Axes object 12 with title 48 contains 2 objects of type line. One or more of the lines displays its values using only markers Axes object 13 with title 47 contains 2 objects of type line. One or more of the lines displays its values using only markers Axes object 14 with title 46 contains 2 objects of type line. One or more of the lines displays its values using only markers Axes object 15 with title 45 contains 2 objects of type line. One or more of the lines displays its values using only markers Axes object 16 with title 44 contains 2 objects of type line. One or more of the lines displays its values using only markers Axes object 17 with title 43 contains 2 objects of type line. One or more of the lines displays its values using only markers Axes object 18 with title 42 contains 2 objects of type line. One or more of the lines displays its values using only markers Axes object 19 with title 41 contains 2 objects of type line. One or more of the lines displays its values using only markers Axes object 20 with title 40 contains 2 objects of type line. One or more of the lines displays its values using only markers Axes object 21 with title 39 contains 2 objects of type line. One or more of the lines displays its values using only markers Axes object 22 with title 38 contains 2 objects of type line. One or more of the lines displays its values using only markers Axes object 23 with title 37 contains 2 objects of type line. One or more of the lines displays its values using only markers Axes object 24 with title 36 contains 2 objects of type line. One or more of the lines displays its values using only markers Axes object 25 with title 35 contains 2 objects of type line. One or more of the lines displays its values using only markers Axes object 26 with title 34 contains 2 objects of type line. One or more of the lines displays its values using only markers Axes object 27 with title 33 contains 2 objects of type line. One or more of the lines displays its values using only markers Axes object 28 with title 32 contains 2 objects of type line. One or more of the lines displays its values using only markers Axes object 29 with title 31 contains 2 objects of type line. One or more of the lines displays its values using only markers Axes object 30 with title 30 contains 2 objects of type line. One or more of the lines displays its values using only markers Axes object 31 with title 29 contains 2 objects of type line. One or more of the lines displays its values using only markers Axes object 32 with title 28 contains 2 objects of type line. One or more of the lines displays its values using only markers Axes object 33 with title 27 contains 2 objects of type line. One or more of the lines displays its values using only markers Axes object 34 with title 26 contains 2 objects of type line. One or more of the lines displays its values using only markers Axes object 35 with title 25 contains 2 objects of type line. One or more of the lines displays its values using only markers Axes object 36 with title 24 contains 2 objects of type line. One or more of the lines displays its values using only markers Axes object 37 with title 23 contains 2 objects of type line. One or more of the lines displays its values using only markers Axes object 38 with title 22 contains 2 objects of type line. One or more of the lines displays its values using only markers Axes object 39 with title 21 contains 2 objects of type line. One or more of the lines displays its values using only markers Axes object 40 with title 20 contains 2 objects of type line. One or more of the lines displays its values using only markers Axes object 41 with title 19 contains 2 objects of type line. One or more of the lines displays its values using only markers Axes object 42 with title 18 contains 2 objects of type line. One or more of the lines displays its values using only markers Axes object 43 with title 17 contains 2 objects of type line. One or more of the lines displays its values using only markers Axes object 44 with title 16 contains 2 objects of type line. One or more of the lines displays its values using only markers Axes object 45 with title 15 contains 2 objects of type line. One or more of the lines displays its values using only markers Axes object 46 with title 14 contains 2 objects of type line. One or more of the lines displays its values using only markers Axes object 47 with title 13 contains 2 objects of type line. One or more of the lines displays its values using only markers Axes object 48 with title 12 contains 2 objects of type line. One or more of the lines displays its values using only markers Axes object 49 with title 11 contains 2 objects of type line. One or more of the lines displays its values using only markers Axes object 50 with title 10 contains 2 objects of type line. One or more of the lines displays its values using only markers Axes object 51 with title 9 contains 2 objects of type line. One or more of the lines displays its values using only markers Axes object 52 with title 8 contains 2 objects of type line. One or more of the lines displays its values using only markers Axes object 53 with title 7 contains 2 objects of type line. One or more of the lines displays its values using only markers Axes object 54 with title 6 contains 2 objects of type line. One or more of the lines displays its values using only markers Axes object 55 with title 5 contains 2 objects of type line. One or more of the lines displays its values using only markers Axes object 56 with title 4 contains 2 objects of type line. One or more of the lines displays its values using only markers Axes object 57 with title 3 contains 2 objects of type line. One or more of the lines displays its values using only markers Axes object 58 with title 2 contains 2 objects of type line. One or more of the lines displays its values using only markers Axes object 59 with title 1 contains 2 objects of type line. One or more of the lines displays its values using only markers Hidden axes object 60 contains 2 objects of type line. One or more of the lines displays its values using only markers These objects represent Predicted - population (Predicted - population.Central.Drug_Central), Observed (Observed.CONC).

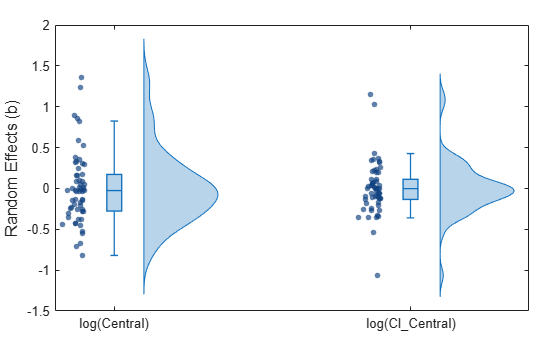
Display the statistics of parameter estimates using box plots, swarm scatter plots, and violin plots.

plotParameterStats(nlmeResults,"box","violin","swarm");

Figure contains an axes object. The axes object contains 5 objects of type boxchart, violinplot, scatter.

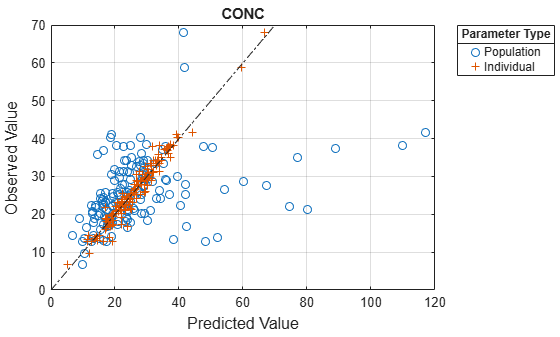
Compare the model predictions to the actual data.

plotActualVersusPredicted(nlmeResults);

Figure contains 2 axes objects. Axes object 1 with title CONC contains 3 objects of type line. One or more of the lines displays its values using only markers Hidden axes object 2 contains 2 objects of type line. One or more of the lines displays its values using only markers These objects represent Individual, Population.

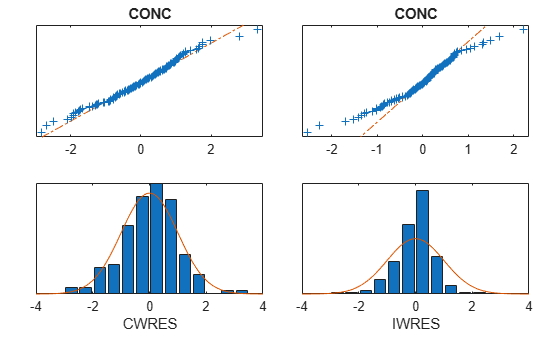
Plot the distribution of residuals.

plotResidualDistribution(nlmeResults);

Figure contains 4 axes objects. Axes object 1 with xlabel IWRES contains 2 objects of type bar, line. Axes object 2 with xlabel CWRES contains 2 objects of type bar, line. Axes object 3 with title CONC contains 3 objects of type line. One or more of the lines displays its values using only markers Axes object 4 with title CONC contains 3 objects of type line. One or more of the lines displays its values using only markers

Plot residuals for each response using the model predictions on x-axis.

plotResiduals(nlmeResults,'Predictions');

Figure contains 2 axes objects. Axes object 1 with title CONC contains 3 objects of type line. One or more of the lines displays its values using only markers Hidden axes object 2 contains 2 objects of type line. One or more of the lines displays its values using only markers These objects represent IWRES, CWRES.

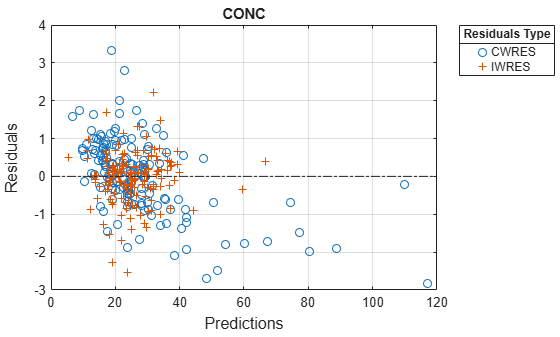
Get the summary of the fit results.

stats.Name contains the name for each table from stats.Table, which contains a list of tables with estimated parameter values and fit quality statistics.

fitMetrics = summary(nlmeResults);

Display the table that contains individual estimates summary statistics.

tableToShow = "Individual Estimates Summary Statistics";
tableNames = {fitMetrics.Name};
tfShowTable = matches(tableNames,tableToShow);
disp(fitMetrics(tfShowTable).Table);
          Statistic           Central    Cl_Central
    ______________________    _______    __________

    {'Minimum'           }    0.62029    0.0021127 
    {'Lower Quartile'    }     1.0676     0.005365 
    {'Median'            }     1.3725    0.0061236 
    {'Upper Quartile'    }     1.6717    0.0068616 
    {'Maximum'           }     5.4555     0.019276 
    {'Mean'              }     1.5713    0.0064928 
    {'Standard Deviation'}    0.90279    0.0026232 

Input Arguments

collapse all

Estimation results, specified as an NLMEResults object or vector of NLMEResults objects.

Output Arguments

collapse all

Parameter estimates and fit statistics, returned as a structure array of tables.

Each structure contains the fields:

  • Name — Name of a fit statistics

  • Table — Table containing values of the corresponding fit statistics

The names of reported statistics tables are as follows:

  • Population Estimates

  • Individual Estimates

  • Individual Estimates Summary Statistics. The table reports the minimum, lower quartile, median, upper quartile, maximum, mean, and standard deviation values for parameter estimates which are weighted equally across each individual.

  • Statistics

  • Fixed Effects

  • Random Effects

  • Individual Parameter Estimate Variability and Quality

  • Random Effects Covariance Matrix

  • Error Model

References

[1] Grasela T.H. Jr, and Donn S.M. "Neonatal population pharmacokinetics of phenobarbital derived from routine clinical data." Developmental Pharmacology and Therapeutics 8, no. 6 (1985): 374–83. https://doi.org/10.1159/000457062.

Version History

Introduced in R2026a