coefCI
Confidence intervals for coefficient estimates of multinomial regression model
Since R2023a
Description
Examples
Load the carbig data set.
load carbigThe variables Horsepower, Weight, and Origin contain data for car horsepower, weight, and country of origin, respectively. The variable MPG contains car mileage data.
Create a table in which the Origin and MPG variables are categorical.
Origin = categorical(cellstr(Origin));
MPG = discretize(MPG,[9 19 29 39 48],"categorical");
tbl = table(Horsepower,Weight,Origin,MPG);
Fit a multinomial regression model. Specify Horsepower, Weight, and Origin as predictor variables, and specify MPG as the response variable.
modelspec = "MPG ~ 1 + Horsepower + Weight + Origin";
mdl = fitmnr(tbl,modelspec);
Find the 95% confidence intervals for the coefficients. Display the coefficient names and confidence intervals in a table by using the array2table function.
ci = coefCI(mdl);
ciTable = array2table(ci, ...
    RowNames = mdl.Coefficients.Properties.RowNames, ...
    VariableNames = ["LowerLimit","UpperLimit"])
ciTable=27×2 table
                               LowerLimit     UpperLimit
                               ___________    __________

    (Intercept_[9, 19))            -89.395       32.927
    Horsepower_[9, 19)             0.14928      0.27499
    Weight_[9, 19)               0.0022537    0.0069061
    Origin_France_[9, 19)          -54.498       69.362
    Origin_Germany_[9, 19)         -62.237       59.666
    Origin_Italy_[9, 19)           -73.457        54.35
    Origin_Japan_[9, 19)           -62.743       59.097
    Origin_Sweden_[9, 19)          -60.076       63.853
    Origin_USA_[9, 19)             -59.875       61.926
    (Intercept_[19, 29))           -78.671       43.544
    Horsepower_[19, 29)            0.12131      0.24115
    Weight_[19, 29)            -0.00073846    0.0033281
    Origin_France_[19, 29)         -49.929       73.841
    Origin_Germany_[19, 29)        -57.315       64.476
    Origin_Italy_[19, 29)          -51.881       73.071
    Origin_Japan_[19, 29)           -58.22       63.559
      ⋮
Each row contains the lower and upper limits for the 95% confidence intervals.
Load the carbig data set.
load carbigThe variables Horsepower, Weight, and Origin contain data for car horsepower, weight, and country of origin. The variable MPG contains car mileage data.
Create a table in which the Origin and MPG variables are categorical.
Origin = categorical(cellstr(Origin));
MPG = discretize(MPG,[9 19 29 39 48],"categorical");
tbl = table(Horsepower,Weight,Origin,MPG);
Fit a multinomial regression model. Specify Horsepower, Weight, and Origin as predictor variables, and specify MPG as the response variable.
modelspec = "MPG ~ 1 + Horsepower + Weight + Origin";
mdl = fitmnr(tbl,modelspec);
Find the 95% and 99% confidence intervals for the coefficients. Display the coefficient names and confidence intervals in a table by using the array2table function.
ci95 = coefCI(mdl);
ci99 = coefCI(mdl,0.01);
confIntervals = array2table([ci95 ci99], ...
    RowNames=mdl.Coefficients.Properties.RowNames, ...
    VariableNames=["95LowerLimit","95UpperLimit", ...
    "99LowerLimit","99UpperLimit"])
confIntervals=27×4 table
                               95LowerLimit    95UpperLimit    99LowerLimit    99UpperLimit
                               ____________    ____________    ____________    ____________

    (Intercept_[9, 19))            -89.395         32.927         -108.66          52.194
    Horsepower_[9, 19)             0.14928        0.27499         0.12948         0.29478
    Weight_[9, 19)               0.0022537      0.0069061       0.0015209       0.0076389
    Origin_France_[9, 19)          -54.498         69.362         -74.007          88.871
    Origin_Germany_[9, 19)         -62.237         59.666         -81.438          78.868
    Origin_Italy_[9, 19)           -73.457          54.35         -93.588          74.481
    Origin_Japan_[9, 19)           -62.743         59.097         -81.935          78.288
    Origin_Sweden_[9, 19)          -60.076         63.853         -79.596          83.373
    Origin_USA_[9, 19)             -59.875         61.926          -79.06          81.111
    (Intercept_[19, 29))           -78.671         43.544         -97.921          62.794
    Horsepower_[19, 29)            0.12131        0.24115         0.10243         0.26003
    Weight_[19, 29)            -0.00073846      0.0033281       -0.001379       0.0039687
    Origin_France_[19, 29)         -49.929         73.841         -69.424          93.336
    Origin_Germany_[19, 29)        -57.315         64.476         -76.498          83.659
    Origin_Italy_[19, 29)          -51.881         73.071         -71.563          92.752
    Origin_Japan_[19, 29)           -58.22         63.559         -77.401           82.74
      ⋮
Each row contains the lower and upper limits for the 95% and 99% confidence intervals.
Visualize the confidence intervals by plotting their limits with the coefficient values.
ci95 = coefCI(mdl);
ci99 = coefCI(mdl,0.01);
colors = lines(3);
hold on
p = plot(mdl.Coefficients.Value,Color=colors(1,:));
plot(ci95(:,1),Color=colors(2,:),LineStyle="--")
plot(ci95(:,2),Color=colors(2,:),LineStyle="--")
plot(ci99(:,1),Color=colors(3,:),LineStyle="--")
plot(ci99(:,2),Color=colors(3,:),LineStyle="--")
hold off
legend(["Coefficients","95% CI","","99% CI",""], ...
    Location="southeast")
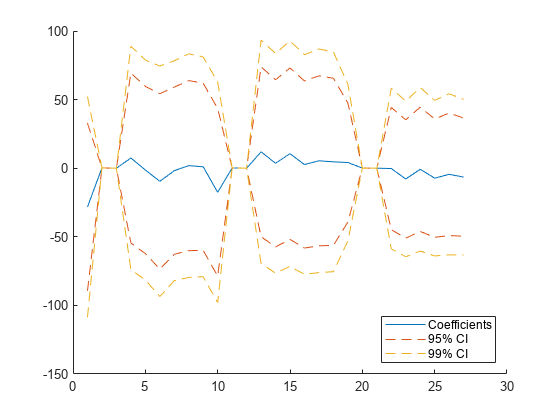
The plot shows that the 99% confidence intervals for the coefficients are wider than the 95% confidence intervals.
Input Arguments
Output Arguments
More About
Version History
Introduced in R2023a