isanomaly
Syntax
Description
tf = isanomaly(forest,Tbl)Tbl using the RobustRandomCutForest model object forest and returns the
logical array tf, whose elements are true when an
anomaly is detected in the corresponding row of Tbl. You must use this
syntax if you create forest by passing a table to the rrcforest
function.
tf = isanomaly(___,Name=Value)ScoreThreshold=0.5
Examples
Create a RobustRandomCutForest model object for uncontaminated training observations by using the rrcforest function. Then detect novelties (anomalies in new data) by passing the object and the new data to the object function isanomaly.
Load the 1994 census data stored in census1994.mat. The data set contains demographic data from the US Census Bureau to predict whether an individual makes over $50,000 per year.
load census1994census1994 contains the training data set adultdata and the test data set adulttest.
Assume that adultdata does not contain outliers. Train a robust random cut forest model for adultdata. Specify StandardizeData as true to standardize the input data.
rng("default") % For reproducibility
[Mdl,tf,s] = rrcforest(adultdata,StandardizeData=true);
Mdl is a RobustRandomCutForest model object. rrcforest also returns the anomaly indicators tf and anomaly scores s for the training data adultdata. If you do not specify the ContaminationFraction name-value argument as a value greater than 0, then rrcforest treats all training observations as normal observations, meaning all the values in tf are logical 0 (false). The function sets the score threshold to the maximum score value. Display the threshold value.
Mdl.ScoreThreshold
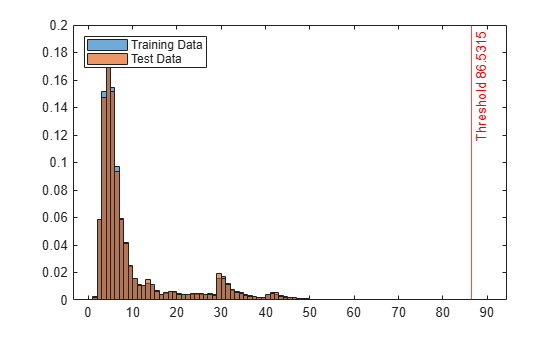
ans =
86.5315
Find anomalies in adulttest by using the trained robust random cut forest model. Because you specified StandardizeData=true when you trained the model, the isanomaly function standardizes the input data by using the predictor means and standard deviations of the training data stored in the Mu and Sigma properties, respectively.
[tf_test,s_test] = isanomaly(Mdl,adulttest);
The isanomaly function returns the anomaly indicators tf_test and scores s_test for adulttest. By default, isanomaly identifies observations with scores above the threshold (Mdl.ScoreThreshold) as anomalies.
Create histograms for the anomaly scores s and s_test. Create a vertical line at the threshold of the anomaly scores.
histogram(s,Normalization="probability")
hold on
histogram(s_test,Normalization="probability")
xline(Mdl.ScoreThreshold,"r-",join(["Threshold" Mdl.ScoreThreshold]))
legend("Training Data","Test Data",Location="northwest")
hold off
Display the observation index of the anomalies in the test data.
find(tf_test)
ans =
3541
The anomaly score distribution of the test data is similar to that of the training data, so isanomaly detects a small number of anomalies in the test data with the default threshold value.
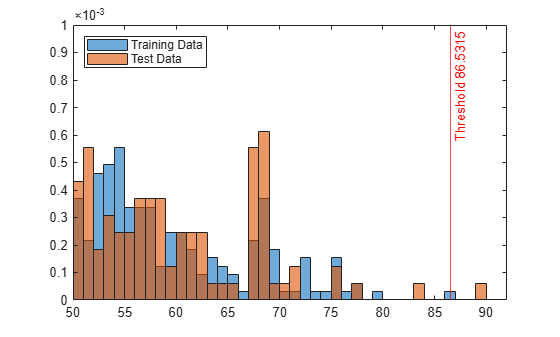
Zoom in to see the anomaly and the observations near the threshold.
xlim([50 92])
ylim([0 0.001])
You can specify a different threshold value by using the ScoreThreshold name-value argument. For an example, see Specify Anomaly Score Threshold.
Specify the threshold value for anomaly scores by using the ScoreThreshold name-value argument of isanomaly.
Load the 1994 census data stored in census1994.mat. The data set contains demographic data from the US Census Bureau to predict whether an individual makes over $50,000 per year.
load census1994census1994 contains the training data set adultdata and the test data set adulttest.
Train a robust random cut forest model for adultdata. Specify StandardizeData as true to standardize the input data.
rng("default") % For reproducibility
[Mdl,tf,scores] = rrcforest(adultdata,StandardizeData=true);
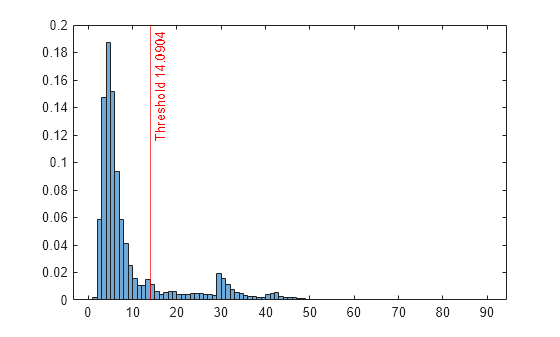
Plot a histogram of the score values. Create a vertical line at the default score threshold.
histogram(scores,Normalization="probability");
xline(Mdl.ScoreThreshold,"r-",join(["Threshold" Mdl.ScoreThreshold]))

Find the anomalies in the test data using the trained robust random cut forest model. Use a different threshold from the default threshold value obtained when training the model.
First, determine the score threshold by using the isoutlier function.
[~,~,U] = isoutlier(scores)
U =
14.0904
Specify the value of the ScoreThreshold name-value argument as U.
[tf_test,scores_test] = isanomaly(Mdl,adulttest,ScoreThreshold=U);
histogram(scores_test,Normalization="probability")
xline(U,"r-",join(["Threshold" U]))
Input Arguments
Name-Value Arguments
Output Arguments
More About
Algorithms
isanomaly considers NaN, '' (empty character vector), "" (empty string), <missing>, and <undefined> values in Tbl and NaN values in X to be missing values.
isanomaly uses observations with missing values to find splits on
variables for which these observations have valid values. The function might place these
observations in a branch node, not a leaf node. Then isanomaly
computes the ratio (Disp(x,C)/|C|) by traversing from the branch node to the root node for each tree. The
function places an observation with all missing values in the root node. Therefore, the
ratio and the anomaly score become the number of training observations for each tree, which
is the maximum possible anomaly score for the trained robust random cut forest model. You
can specify the number of training observations for each tree by using the NumObservationsPerLearner name-value argument.
References
[1] Guha, Sudipto, N. Mishra, G. Roy, and O. Schrijvers. "Robust Random Cut Forest Based Anomaly Detection on Streams," Proceedings of The 33rd International Conference on Machine Learning 48 (June 2016): 2712–21.
[2] Bartos, Matthew D., A. Mullapudi, and S. C. Troutman. "rrcf: Implementation of the Robust Random Cut Forest Algorithm for Anomaly Detection on Streams." Journal of Open Source Software 4, no. 35 (2019): 1336.
Extended Capabilities
Version History
Introduced in R2023a