plot
R2026bVisualize 3-D point cloud and camera trajectory from structure-from-motion (SfM) reconstruction
Since R2026b
Description
plot( plots the reconstructed 3-D
points and estimated camera trajectory stored in the sfmObj)sfm object
sfmObj. Visualize intermediate or final results of reconstruction
using the plot function at any stage after calling the
triangulateInitialViews object function.
plot(
specifies visualization options using one or more name-value arguments. For example,
sfmObj,Name=Value)plot(sfmObj,CameraSize=0.3) increases the displayed camera size.
Examples
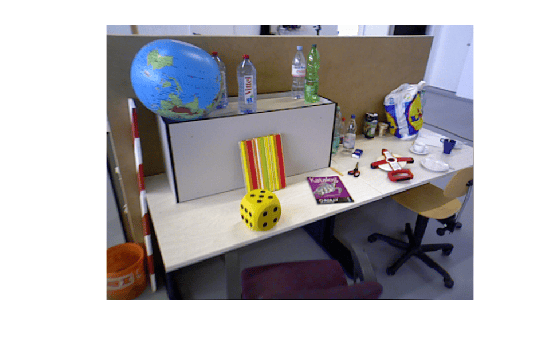
Use the sfm object to recover camera poses and a sparse 3-D point cloud from images of an indoor scene.
Create Image Datastore and Define Camera Intrinsics
Create an ImageDatastore from the image sequence. Specify the camera intrinsic parameters.
unzip("sfm_images.zip")
imageFolder = fullfile(pwd,"images");
imds = imageDatastore(imageFolder);
intrinsics = cameraIntrinsics([535.1307 532.1860],[323.3722 239.7986],[480 640]);
Visualize the indoor scene.
imshow(preview(imds))
Create SfM Object and Run Pipeline
Create an sfm object and execute each stage of the incremental SfM pipeline sequentially.
sfmObj = sfm(imds,intrinsics);
Connect image pairs based on visual similarity.
sfmObj = connectImagePairs(sfmObj);
Visualize the similarity matrix for the connected image pairs using the imagesc function.
imagesc(sfmObj.SimilarityMatrix)
title("Similarity Matrix for Connected Image Pairs")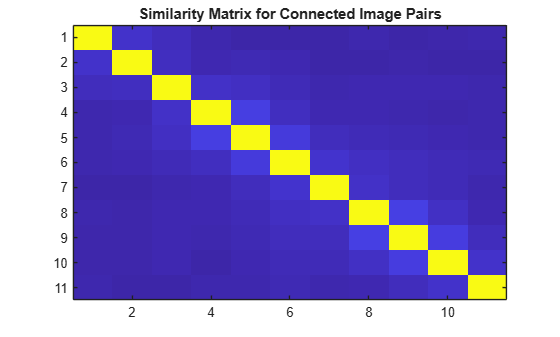
Verify that the view graph was created successfully before proceeding to geometric verification.
if isConnected(sfmObj)
    sfmObj = verifyImagePairs(sfmObj);
end
Visualize the similarity matrix for the refined image pair connections using the imagesc function.
imagesc(sfmObj.SimilarityMatrix)
title("Similarity Matrix after Refining Connected Image Pairs")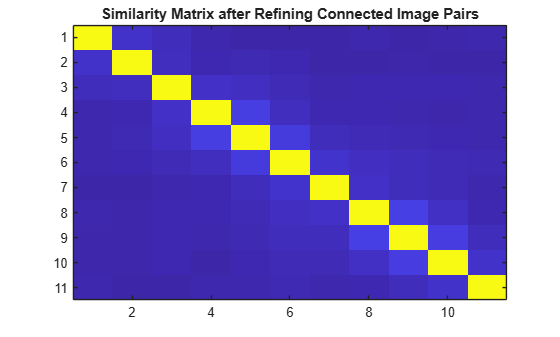
Confirm that geometric verification completed successfully before initializing the reconstruction. Specify a minimum median angle of 5 degrees and a maximum triangulation error of 4 pixels. Display the initialization metrics.
if isVerified(sfmObj)
    [sfmObj,info] = triangulateInitialViews(sfmObj,MinMedianAngle=5,MaxTriangulationError=4);
    disp(info)
end
                     ViewId1: 9
                     ViewId2: 10
                RelativePose: [1×1 rigidtform3d]
                     Matches: [380×2 uint32]
    MedianTriangulationAngle: 8.6016
       MeanReprojectionError: 0.2799
Confirm that initialization succeeded before running incremental reconstruction.
if isInitialized(sfmObj)
    sfmObj = reconstruct(sfmObj);
end
Retrieve Results
Retrieve the estimated camera poses and the sparse 3-D point cloud.
camPoses = poses(sfmObj);
sparsePoints = pointCloud(sfmObj);
Visualize Reconstruction
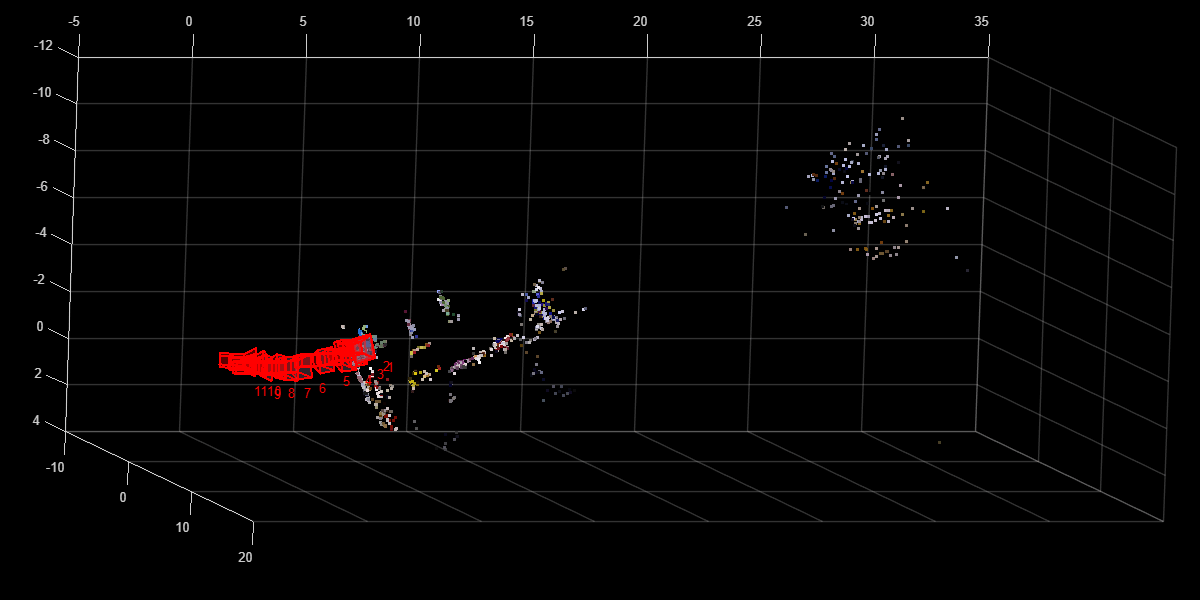
Display the reconstructed scene showing the camera trajectory and sparse point cloud. Adjust the view orientation and zoom for better visualization.
plot(sfmObj,CameraSize=0.5,MarkerSize=25)
view(82.69,-15.53)
camroll(-90)
camva(4.52)
Input Arguments
Name-Value Arguments
Version History
Introduced in R2026b

