Get Started with Object Detector Analyzer App
The Object Detector Analyzer app enables you to interactively visualize and evaluate object detector performance in MATLAB®. Using the app, you can generate object detection results by running inference using a pretrained detector, or import precomputed object detection results. You can then compare the detection results against ground truth data and evaluate key performance metrics, such as the confusion matrix, precision, recall, F1 score, and mean average precision (mAP), across a range of intersection over union (IOU) thresholds. After analyzing the results and the performance metrics, you can export them directly from the app for further use.
This example illustrates how to import precomputed object detection results, evaluate performance metrics, and visualize results using the Object Detector Analyzer app.
Types of Object Detection Analysis Sessions
You can create these types of analysis sessions using the Object Detector Analyzer app:
Evaluate detector without ground truth — Use this to only quickly review detection results without computing performance metrics.
Evaluate detector performance against ground truth — Use this to compare detection results against ground truth and compute detection performance metrics.
Create Session To Evaluate Detection Results Without Ground Truth
To create an analysis session to evaluate detection results without ground truth, you must provide these inputs:
Image data set
Pretrained detector or precomputed detection results
This figure illustrates the New Session dialog to create an analysis session for evaluating detection results without ground truth.
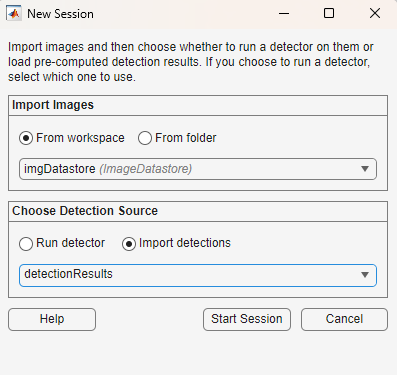
For evaluating detection results without ground truth, the New Session dialog contains these options:
Import Option | Input |
|---|---|
Import Images | Specify an image data set using one of these methods: 1. From workspace — Specify a datastore object in the MATLAB workspace that returns images, such as an 2. From folder — Specify the path to a folder containing all the images. |
Choose Detection Source | Specify the source of object detection results using one of these methods: 1. Run detector — Select a pretrained object detector from the MATLAB workspace. For a list of supported pretrained object detectors, see Run Supported Object Detectors. If you select this option, you can also specify these inference options from the Detector Settings section: - Mini-batch size —Size of the mini-batch to use for each training iteration, specified as a positive integer. - Execution environment — Specify the execution environment for the detector as 2. Import detections — Specify precomputed detection results as a table with the same number of rows as the number of images in the imported data set, with these columns: Each row of the matrix specifies the coordinates of a bounding box as [x y w h], where x and y are the upper-left corner of the box in pixel coordinates. - - |
Create Session To Evaluate Detector Performance Against Ground Truth
To create an analysis session to compare detection results against ground truth and evaluate performance metrics, you must provide these inputs:
A ground truth data set containing images and axis-aligned bounding box labels
Pretrained detector or precomputed detection results
This figure illustrates the New Session dialog to create an analysis session for evaluating detector performance against ground truth.
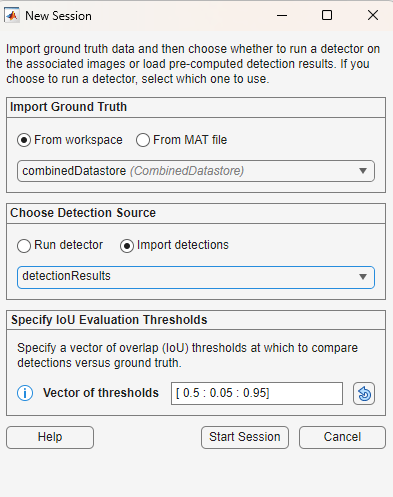
For evaluating detection results against ground truth and generating performance metrics, the New Session dialog contains these options:
Import Dialog Option | Accepted Formats |
|---|---|
Import Ground Truth | Specify a ground truth dataset using one of these methods: 1. From workspace — Specify a 2. From MAT file — Specify the path to a MAT file that contains a |
Choose Detection Source | Specify the source of object detection results using one of these methods: 1. Run detector — Select a pretrained object detector from the MATLAB workspace. For a list of supported pretrained object detectors, see Run Supported Object Detectors. If you select this option, you can also specify these runtime options from the Detector Settings section: - Mini-batch size —Size of the mini-batch to use for each training iteration, specified as a positive integer. - Execution environment — Specify the execution environment for the detector as 2. Import detections — Specify precomputed detection results as a table with the same number of rows as the number of images in the imported data set, with these columns: Each row of the matrix specifies the coordinates of a bounding box as [x y w h], where x and y are the upper-left corner of the box in pixel coordinates. - - |
Specify IoU Evaluation Thresholds | Specify a vector of intersection-over-union (IoU) thresholds to compare detection results against the ground truth. Each threshold defines the amount of overlap (IoU) a detection must have with a ground truth box to count as a true detection. Enter custom threshold values as either: - A range of values — [min : step : max] - A list of values — [val1 val2 val3 ...] All IoU threshold values must be between For more information about IoU evaluation threshold, see Evaluate Detection Matches Using IoU and Overlap Threshold. |
This example shows you how to import precomputed detection results into the Object Detector Analyzer app and create an analysis session for comparing detection results against the ground truth and evaluating performance metrics.
Load Data and Create Combined Ground Truth Data Set
This example uses the Indoor Object Detection Dataset created by Bishwo Adhikari et al., [1], which contains 2207 labeled images of indoor scenes across 7 object classes: exit, fire extinguisher, chair, clock, trash bin, screen, and printer.
Use the helperDownloadDataset helper function to download the data set and return the path where the data is stored.
pathToDataSet = helperDownloadDataset;
Downloading 401 MB Indoor Objects Dataset images...
Create an image datastore from the images in the downloaded dataset.
imgDatastore = imageDatastore(pathToDataSet,IncludeSubfolders=true,FileExtensions=".jpg");
imshow(preview(imgDatastore))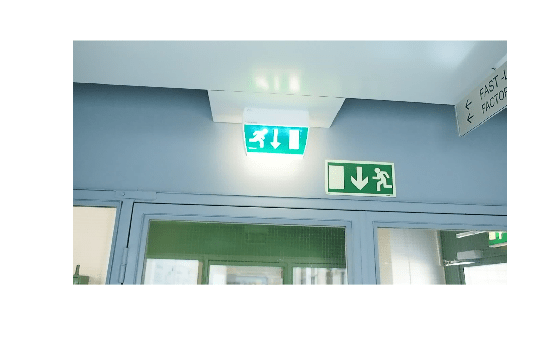
Load the box label datastore containing the ground truth labels into the workspace.
labelDatastore = load("gtLabelsAndDetResults.mat").BBstore;Filter out the images with no labels.
cleanIdx = load("gtLabelsAndDetResults.mat").idxs;
imgDatastore = subset(imgDatastore,cleanIdx);
labelDatastore = subset(labelDatastore,cleanIdx);
Combine the filtered image datastore and the ground truth box label datastore. You can specify this combined datastore as ground truth to the Object Detector Analyzer app.
combinedDatastore = combine(imgDatastore,labelDatastore)
combinedDatastore =
  CombinedDatastore with properties:

      UnderlyingDatastores: {[1×1 matlab.io.datastore.ImageDatastore]  [1×1 boxLabelDatastore]}
    SupportedOutputFormats: ["txt"    "csv"    "dat"    "asc"    "xlsx"    "xls"    "parquet"    "parq"    "png"    "jpg"    "jpeg"    "tif"    "tiff"    "wav"    "flac"    "ogg"    "opus"    "mp3"    "mp4"    "m4a"]
Load and Visualize Precomputed Detection Results
Load the table of precomputed detection results into the workspace. Display the first few rows of the table and note that it follows the format the Object Detector Analyzer app accepts for imported detections.
detectionResults = load("gtLabelsAndDetResults.mat").detectionResults;
head(detectionResults)
Boxes Scores Labels
_____________ _____________ __________________
{ 9×4 double} { 9×1 single} { 9×1 categorical}
{ 7×4 double} { 7×1 single} { 7×1 categorical}
{10×4 double} {10×1 single} {10×1 categorical}
{22×4 double} {22×1 single} {22×1 categorical}
{32×4 double} {32×1 single} {32×1 categorical}
{25×4 double} {25×1 single} {25×1 categorical}
{29×4 double} {29×1 single} {29×1 categorical}
{31×4 double} {31×1 single} {31×1 categorical}
Import Data and Start Object Detection Analysis Session
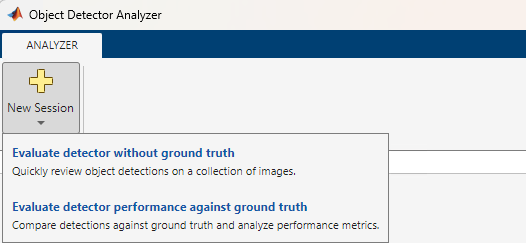
Open the Object Detector Analyzer app.
objectDetectorAnalyzer
To start a new object detection performance evaluation session, on the app toolstrip, select New Session > Evaluate detector performance against ground truth.
In the New Session dialog, specify these options::
Import Ground Truth — Select the From Workspace option, and in the drop-down, choose the workspace variable
combinedDataStore.Choose Detection Source — To use the precomputed object detection results, select Import detections. Then, from the dropdown, select the
detectionResultstable from the workspace.Specify IoU Evaluation Thresholds — Specify a custom vector of intersection-over-union (IoU) thresholds or retain the default value:
[0.5:0.05:0.95].
Click Start Session. The app computes detection performance metrics across the specified IoU thresholds and generates visualizations for analysis.
Detection Score and Overlap (IoU) Thresholds
From the app toolstrip, you can specify the Score Threshold and Overlap (IoU) Threshold values for which the app currently visualizes the object detection results and detector performance metrics. You can modify these values to see the analysis at different values and then select the best threshold parameters for your application.
Analyze Detection Performance Per Image
On the image tab of the central pane, you can scroll through all the images in the data set and visually compare the detected and missed objects on each image. Use the Image Browser pane to navigate through the images. You can sort the images based on performance metrics such as F1-Score, precision and recall to quickly identify the images with the most detection errors. Alternatively, you can sort by the import order. You can also rearrange the order of images in ascending or descending sequence.
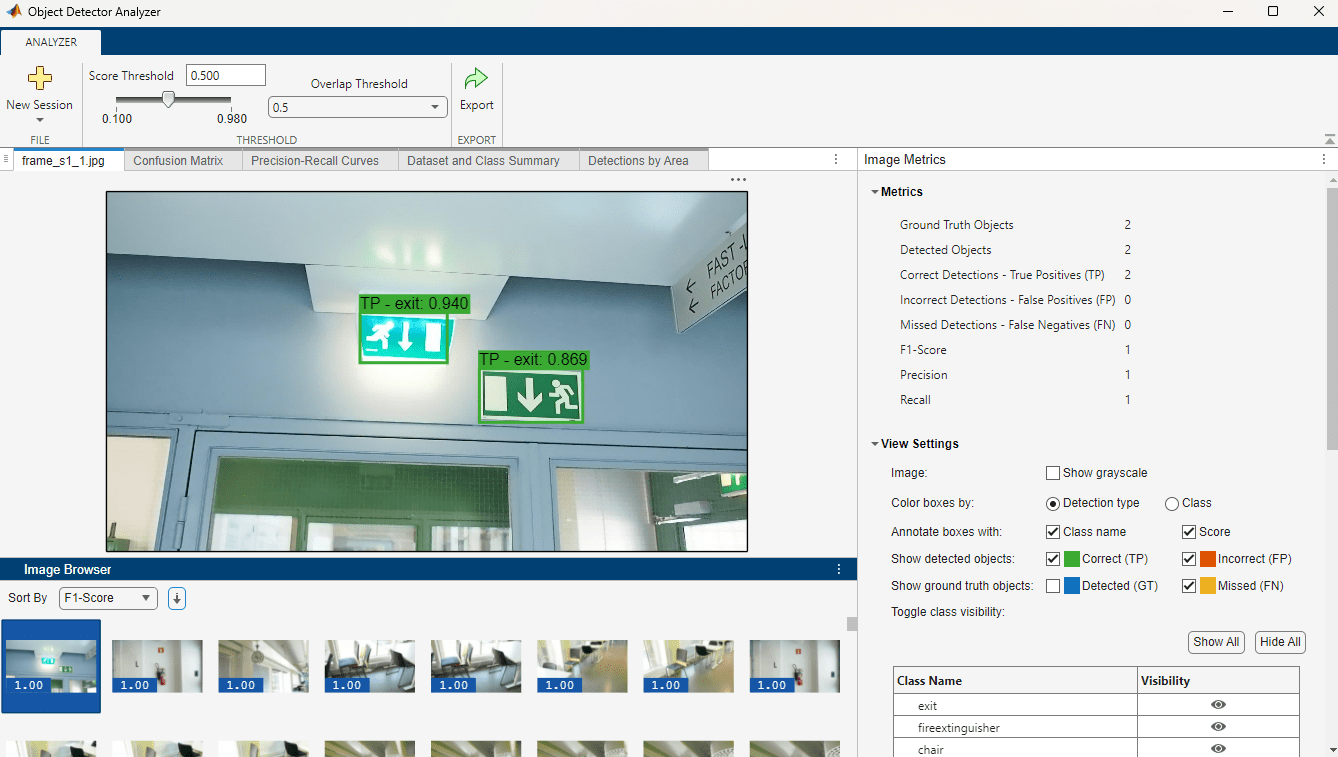
Image Metrics
The Image Metrics panel on the pane contains these sections:
Metrics
The Metrics pane displays these detection metrics for the currently selected image:
Ground Truth Objects
Detected Objects
Correct Detections - True Positives (TP)
Incorrect Detections - False Positives (FP)
Missed Detections - False Negatives (FN)
F1-Score
Precision
Recall
View Settings
You can use these settings to customize what the app displays on the current image.
Toggle the visibility of true positive (TP), false positive (FP), false negative (FN) detections, as well as ground truth (GT) objects.
Show or hide class names and detection score annotations on bounding boxes.
Toggle visibility of individual classes.
Option to display the image in grayscale.
Detected Objects
Displays a table of classes detected on the current image, with these columns:
Class — Class label of the detection
Result — Detection type (
TPorFP)Score — Confidence score of the detection
Overlap — IoU score of the detection
You can click and select a class in the table to highlight the corresponding detections in the image.
Ground Truth Objects
Displays a table of ground truth classes in the current image that were not detected (FN).
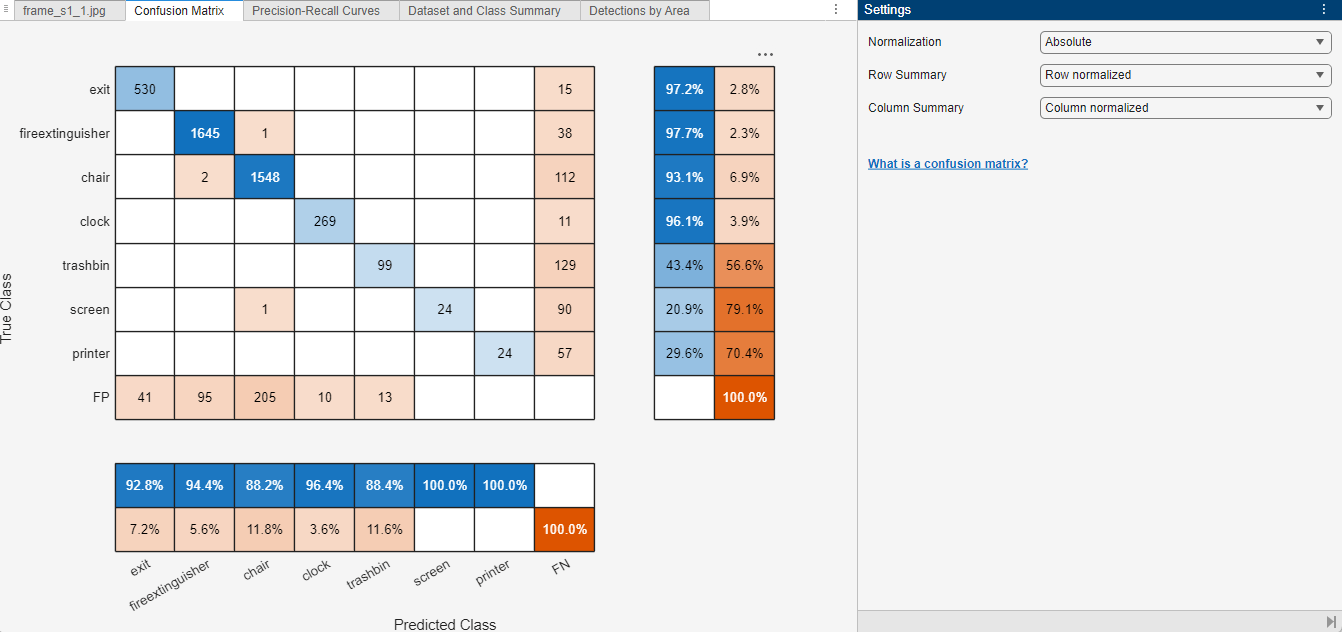
Analyze Confusion Matrix
In the Confusion Matrix tab, you can visualize the ability of the object detector to distinguish between different object classes by using a confusion matrix based on the detection results at the specified detection and overlap thresholds. For more information about confusion matrices, see Evaluate Confusion Matrix.
Use the Settings panel to customize the display format of the confusion matrix. You can toggle between absolute values (raw counts) and normalized values (percentages) for the confusion matrix, as well as for the optional row and column summaries.
In addition to the prediction and ground truth comparisons for each class, the visualization can also display summaries for the rows and columns of the confusion matrix.
Row Summary — Displays the total number of true positives and false negatives for each true class.
Column Summary — Displays the total number of true positives and false positives for each predicted class.
For instance, in this image:
The confusion matrix displays Absolute values.
The row summary displays Row-normalized values indicating the percentage of correct predictions and false negatives for each true class.
The column summary displays Column-normalized values indicating the percentage of correct predictions and false positives for each predicted class.
Note: To compute the confusion matrix, the Object Detector Analyzer app requires a Statistics and Machine Learning Toolbox™ or Deep Learning Toolbox™ license.
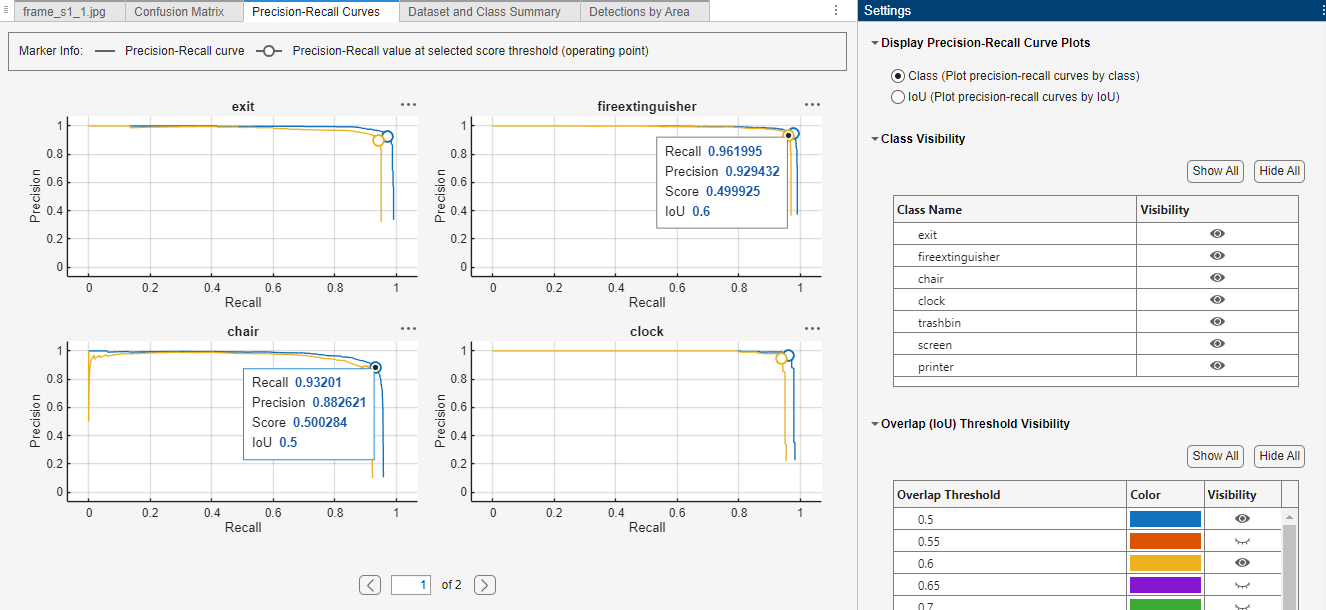
Analyze Precision-Recall Curves
In the Precision-Recall Curves tab, you can analyze the tradeoff between precision (the accuracy of detected positive predictions) and recall (how well the detector finds all true objects). For more information about precision-recall (P-R) curves, see Evaluate Precision and Recall.
In the Settings pane, use the Display Precision-Recall Curve Plots option to toggle the visualization between these two options:
View Precision-Recall Curves for Each Class at Selected IoU Thresholds — Class View
In this mode, the app displays a separate P-R curve plot for each object class at the selected IoU threshold. You can toggle additional IoU thresholds to overlay their corresponding P-R curves on each class plot, enabling you to compare performance across various IoU levels for individual classes.
View Precision-Recall Curves for Each IoU with Selected Classes — IoU View
Alternatively, you can view a separate P-R curve plot for each IoU threshold, where each plot contains the P-R curves for all object classes at that threshold. Toggling additional IoU thresholds adds new plots to the display, enabling you to compare how class-level performance varies across different IoU values.
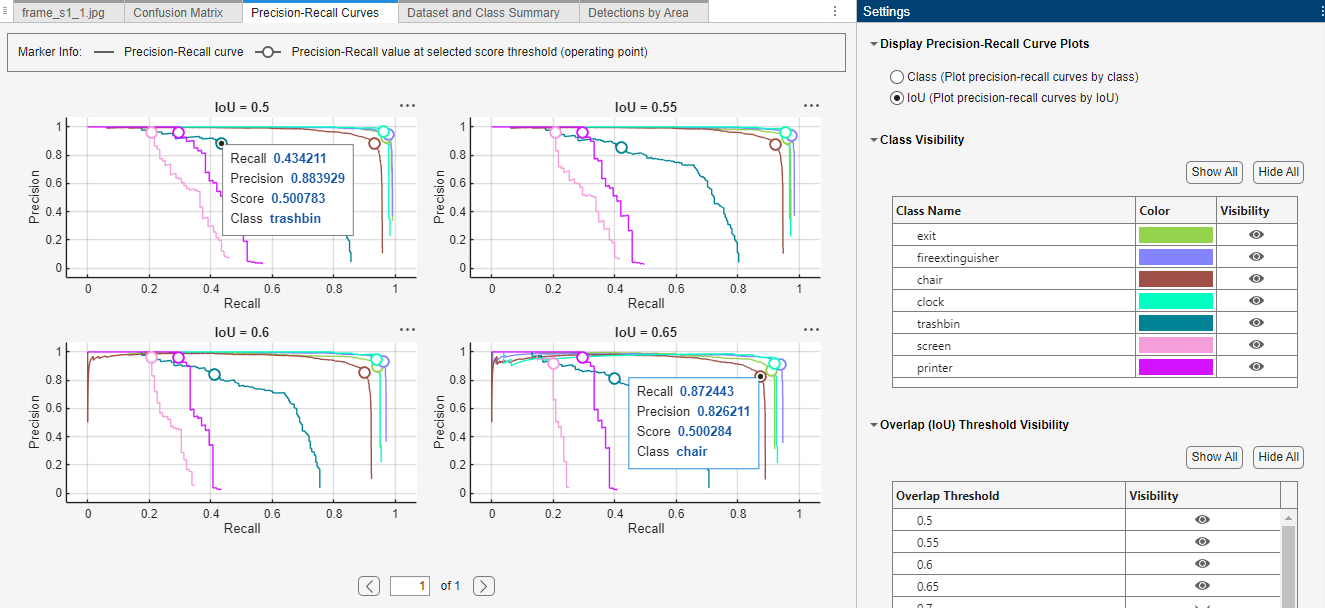
In both views, the P-R curves show an operating point marker on each curve, based on the specified detection score threshold. Selecting the marker reveals the exact precision and recall values at that point, helping you interpret model performance at your chosen operating threshold.
Analyze Data Set and Class Summary
The Dataset and Class Summary tab provides a comprehensive overview of object detection performance metrics for the entire data set. It includes these collapsible sections, each offering a different perspective on the metrics:
Detection Summary
Ground Truth Object Size Distribution
Dataset Metrics
Average Precision (AP)
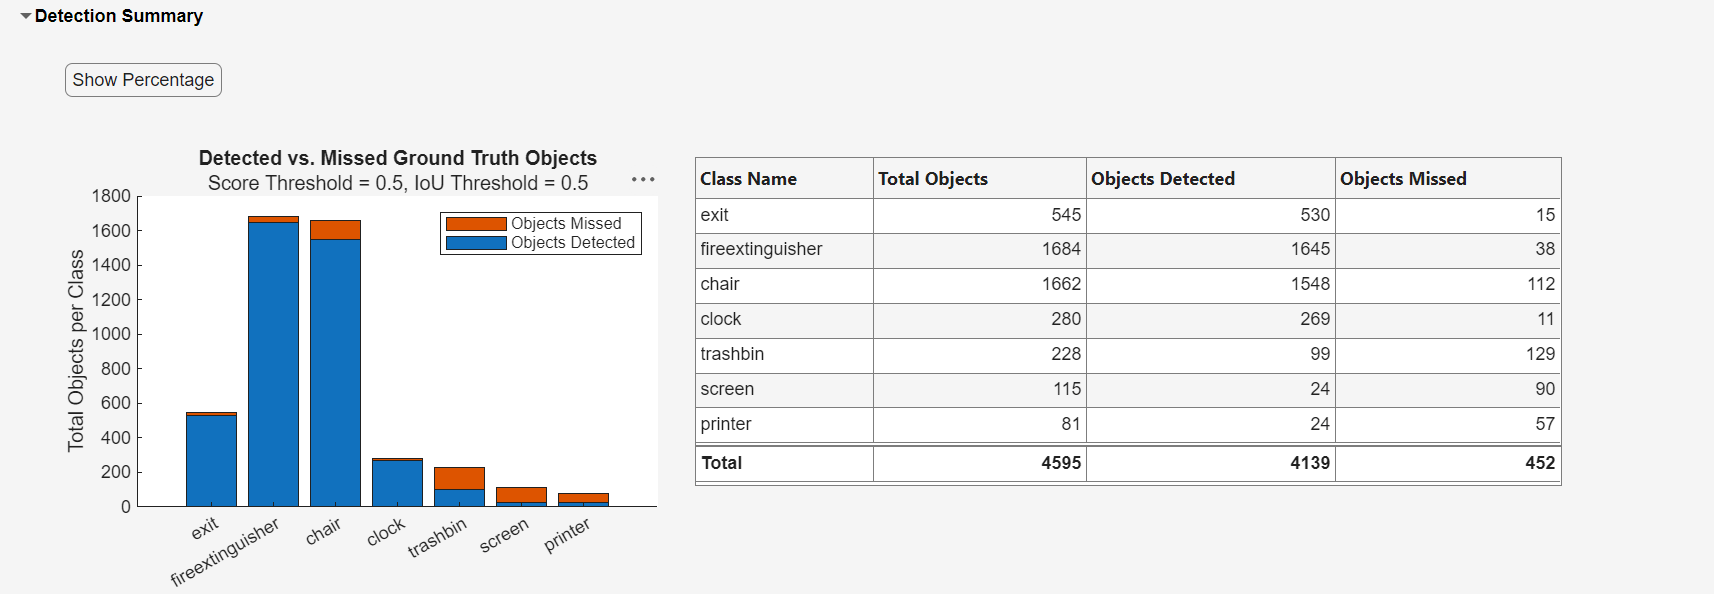
Detection Summary
The Detection Summary section shows a bar plot of detected versus missed objects out of the total ground truth objects, across all classes. It also displays the same data in a table. You can toggle between absolute counts and percentage values by selecting Show Percentage.
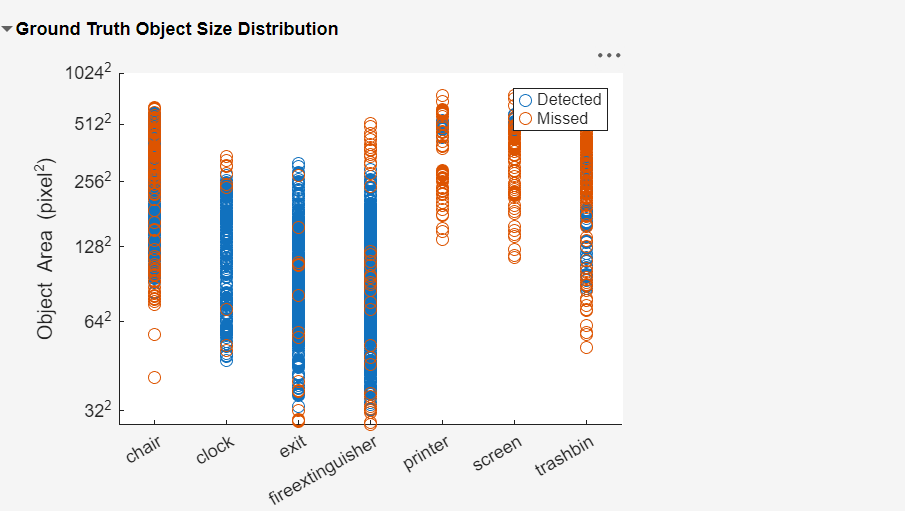
Ground Truth Object Size Distribution
The Ground Truth Object Size Distribution pane shows a scatter plot that visualizes the distribution of detected and missed objects based on their pixel area. For a more in-depth view of the performance metrics by area, see Analyze Metrics By Area.
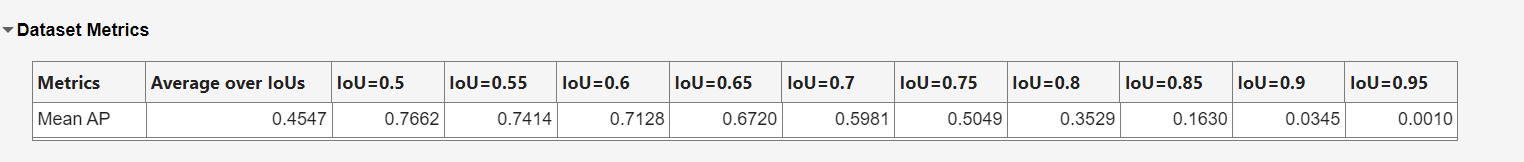
Dataset Metrics
The Dataset Metrics pane shows mean average precision (mAP) values for the entire data set across the intersection over union (IoU) threshold range. For each IoU threshold, the app calculates the mAP values by averaging the AP values of all the object classes. The table also shows the average mAP value over all the IoU threshold values.
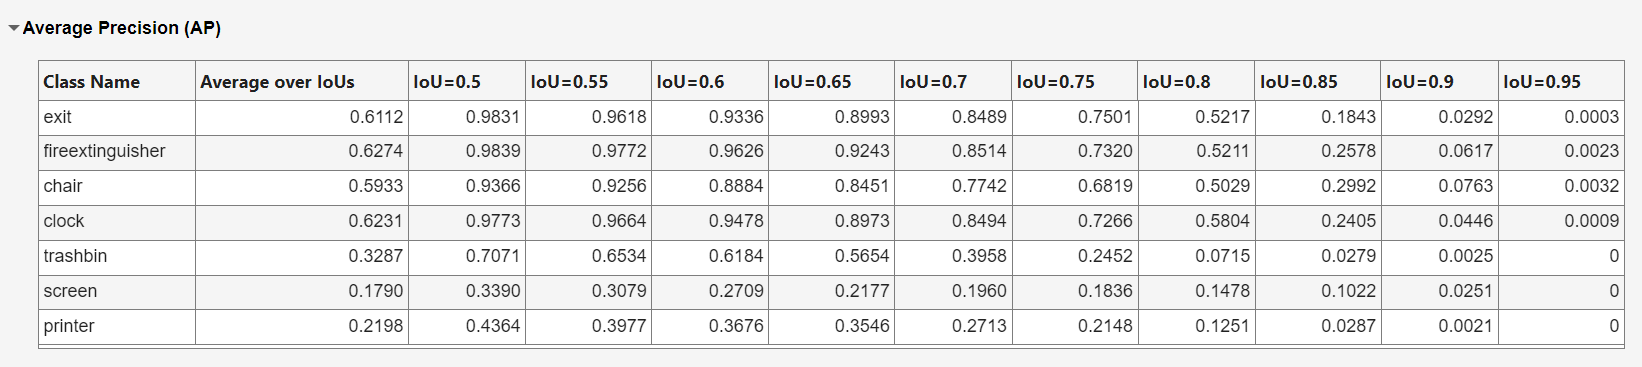
Average Precision
The Average Precision panel provides a per-class view of average precision across the intersection over union (IoU) threshold range.
Analyze Detections by Area
The Detections by Area tab provides a detailed distribution of the detected and missed objects based on their pixel area range for each object class. The plot is organized by object class which helps illustrate how object size affects detection accuracy.
In the Settings pane, you can toggle the Correct (TP), Incorrect (FP), Detected (GT), and Missed (FN) options to specify whether to visualize the correct detections (true positives), incorrect detections (false positives), missed detections (false negatives) and ground truth objects.

Export Object Detection Metrics
To export object detection results and performance metrics from the app:
On the app toolstrip, select Export.
In the Export to workspace dialog:
Choose whether to export all detections or only those above the selected detection confidence threshold.
Specify the variable names for the detections and metrics.
Select OK.
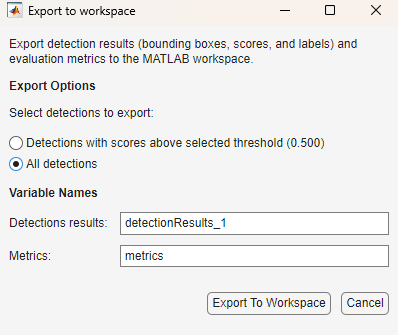
The app exports these files:
detectionResults_1— A table containing the bounding boxes in each image, along with their corresponding confidence scores and class labels.metrics— AnobjectDetectionMetricsobject that contains all the evaluated performance metrics.
You can use the exported detection results and metrics for future application and evaluation.
For more detailed information about the performance metrics, see Evaluate Object Detector Performance.
References
[1] Adhikari, Bishwo, Jukka Peltomaki, Jussi Puura, and Heikki Huttunen. “Faster Bounding Box Annotation for Object Detection in Indoor Scenes.” 2018 7th European Workshop on Visual Information Processing (EUVIP), IEEE, November 2018, 1–6. https://doi.org/10.1109/EUVIP.2018.8611732.