The "DisplayName" option for the plot function Should support string array input
Currently, according to the official documentation, "DisplayName" only supports character vectors or single scalar string as input. For example, when plotting three variables simultaneously, if I use a single scalar string as input, the legend labels will all be the same. To have different labels, I need to specify them separately using the legend function with label1, label2, label3.
Here's an example illustrating the issue:
x = (1:10)';
y1 = x;
y2 = x.^2;
y3 = x.^3;
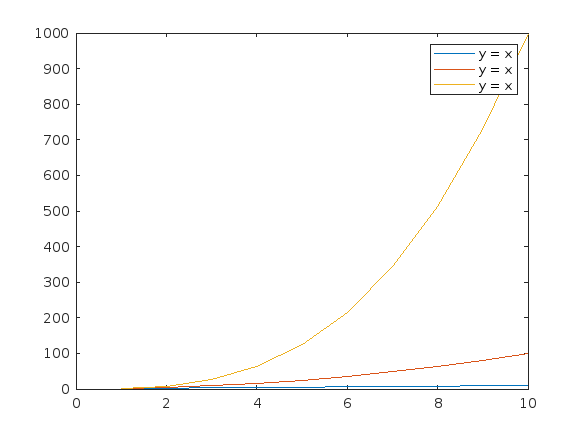
% Plotting with a string scalar for DisplayName
figure;
plot(x, [y1,y2,y3], DisplayName="y = x");
legend;
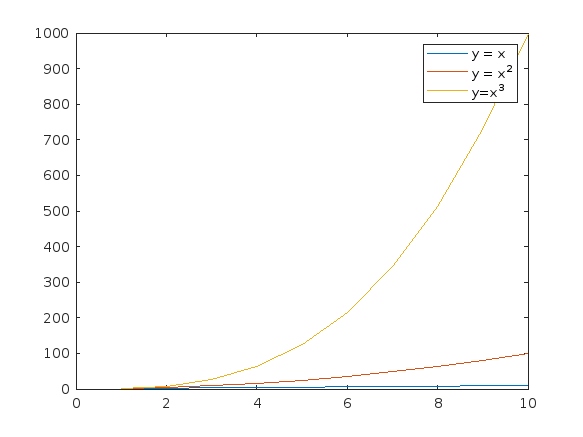
% To have different labels, I need to use the legend function separately
figure;
plot(x, [y1,y2,y3], DisplayName=["y = x","y = x^2","y=x^3"]);
% legend("y = x","y = x^2","y=x^3");
6 Comments
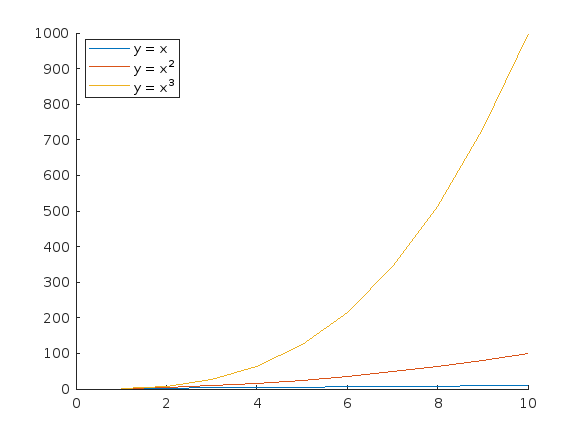
Time DescendingThanks for sharing your thoughts @cui,xingxing. Here a workaround that doesn't require a loop but does require a second line of code.
x = (1:10)';
y1 = x;
y2 = x.^2;
y3 = x.^3;
figure;
h = plot(x, [y1,y2,y3]);
set(h, {'DisplayName'}, {"y = x";"y = x^2";"y=x^3"})
legend
I usually do something like this —
x = (1:10)';
y{1} = x;
y{2} = x.^2;
y{3} = x.^3;
DN = ["x" "x^2" "x^3"];
% Plotting with a string scalar for DisplayName
figure
hold on
for k = 1:numel(DN)
plot(x, y{k}, DisplayName="y = "+DN(k));
end
hold off
legend(Location='best')
% % To have different labels, I need to use the legend function separately
% figure;
% plot(x, [y1,y2,y3], DisplayName=["y = x","y = x^2","y=x^3"]);
% % legend("y = x","y = x^2","y=x^3");
.
I don’t like loop annotations; it would be better if vectorized annotations were supported.
I'm on mobile so I can't test it, but wouldn't something with deal() work if you're se on avoiding loops?
I would prefer a string array to result in multiple lines.
Is there any other of the Name Value pairs that already works like you suggest?
No, I haven't encountered it yet.
Sign in to participate