Results for

Starting in MATLAB R2022a, use the append option in exportgraphics to create GIF files from animated axes, figures, or other visualizations.
This basic template contains just two steps:
% 1. Create the initial image file
gifFile = 'myAnimation.gif';
exportgraphics(obj, gifFile);
% 2. Within a loop, append the gif image
for i = 1:20
      %   %   %   %   %   %    %
      % Update the figure/axes %
      %   %   %   %   %   %    %
exportgraphics(obj, gifFile, Append=true); end
Note, exportgraphics will not capture UI components such as buttons and knobs and requires constant axis limits.
To create animations of images or more elaborate graphics, learn how to use imwrite to create animated GIFs .
Share your MATLAB animated GIFs in the comments below!
See Also
This Community Highlight is attached as a live script
Did you know you can use most emoticons in text objects?
Most emoticons are just unicode characters. Using them as characters in Matlab is as simple as finding their numeric representation and then converting the numeric value back to character. Not all emoticons are convertible in Matlab.
Here's a secret message with emoticons. Use char(x) to decode it.
x = [79 77 71 33 32 55357 56878 32 104 97 118 101 32 121 111 ...
    117 32 117 112 100 97 116 101 100 32 116 111 32 77 97 116 ...
    108 97 98 32 55358 56595 32 114 50 48 50 49 97 32 121 101 116 32 8265];
Happy St. Patrick's Day!
fig = figure('MenuBar','none','Color', [0 .62 .376]);  % Shamrock green
ax = axes(fig,'Units','Normalized','Position',[0 0 1 1]);
axis(ax,'off')
axis(ax,'equal')
hold(ax,'on')
xlim(ax,[-1,1]); ylim(ax,[-1,1])
text(ax, 0, 0, char(9752), 'VerticalAlignment','middle','HorizontalAlignment','center','FontSize', 200)
str = num2cell('Happy St Patrick''s day!');
th = linspace(-pi/2,pi/2,numel(str));
txtHandle = text(ax,sin(th)*.8, cos(th)*.8, str, 'VerticalAlignment','middle','HorizontalAlignment','center','FontSize', 25);
set(txtHandle,{'rotation'}, num2cell(rad2deg(-th')))
thr = 0.017;
rotateCCW = @(xyz)([cos(thr) -sin(thr) 0; sin(thr), cos(thr), 0; 0 0 1]*xyz.').';
while all(isvalid(txtHandle))
    newposition = rotateCCW(vertcat(txtHandle.Position));
    set(txtHandle,{'position'}, mat2cell(newposition,ones(numel(txtHandle),1),3), ...
        {'rotation'}, num2cell([txtHandle.Rotation].'+thr*180/pi))
    drawnow()
end
Starting in r2020a, AppDesigner buttons and TreeNodes can display animated GIFs, SVG, and truecolor image arrays.
Every component in the App above is either a Button or a TreeNode!
Prior to r2020a the icon property of buttons and TreeNodes in AppDesigner supported JPEG, PNG, or GIF image files specified by a character vector or string array but did not support animation.
Here's how to display an animated GIF, SVG, or truecolor image in an App button or TreeNode starting in r2020a. And for the record, "GIF" is pronounced with a hard-g .
Display an animated GIF
Select the button or TreeNode from within AppDesigner > Design View and navigate to Component Browser > Inspector > Button dropdown list of properties (shown below). Select an animated GIF file and set the text and icon alignment properties.
To set the icon property programmatically,
app.Button.Icon = 'launch.gif'; % or "launch.gif"
The filename can be an image file on the Matlab path (see addpath ) or a full path to an image file.
Display SVG
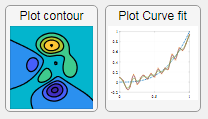
Use “scalable vector graphics” files for high-resolution images that are scaled to different sizes while preserving their shape and retaining their clarity. A quick and easy way to remember which plotting function is assigned to each button in an app is to assign an image of the plot to the button.
After creating the figure, expand the axes by setting the position or outerposition property to [0 0 1 1] in normalized units and save the figure using File > Save as and select svg format. Save the image to the folder containing your app. Then follow the same procedure as animated GIFs.
Display truecolor image
A truecolor image comes in the form of an [m x n x 3] array where each m x n pixel color is specified by an RGB triplet (read more) . This feature allows you to dynamically create a digital image or to upload an image from a mat file rather than an image file.
In this example, a progress bar is created within the uibutton callback function and it’s updated within a loop. For a complete demo of this feature see this comment .
% Button pushed function: ProcessDataButton
function ProcessDataButtonPushed(app, event)
    % Change button name to "Processing"
    app.ProcessDataButton.Text = 'Processing...';
    % Put text on top of icon
    app.ProcessDataButton.IconAlignment = 'bottom';
    % Create waitbar with same color as button
    wbar = permute(repmat(app.ProcessDataButton.BackgroundColor,15,1,200),[1,3,2]);
    % Black frame around waitbar
    wbar([1,end],:,:) = 0;
    wbar(:,[1,end],:) = 0;
    % Load the empty waitbar to the button
    app.ProcessDataButton.Icon = wbar;
    % Loop through something and update waitbar
    n = 10;
    for i = 1:n
        % Update image data (royalblue)
        % if mod(i,10)==0 % update every 10 cycles; improves efficiency
         currentProg = min(round((size(wbar,2)-2)*(i/n)),size(wbar,2)-2);
         RGB = app.ProcessDataButton.Icon;
         RGB(2:end-1, 2:currentProg+1, 1) = 0.25391; % (royalblue)
         RGB(2:end-1, 2:currentProg+1, 2) = 0.41016;
         RGB(2:end-1, 2:currentProg+1, 3) = 0.87891;
           app.ProcessDataButton.Icon = RGB;
          % Pause to slow down animation
          pause(.3)
          % end
      end
      % remove waitbar
      app.ProcessDataButton.Icon = '';
      % Change button name
      app.ProcessDataButton.Text = 'Process Data';
  end
The for-loop above was improved on Feb-11-2022.
Credit for the black & teal GIF icons: lordicon.com