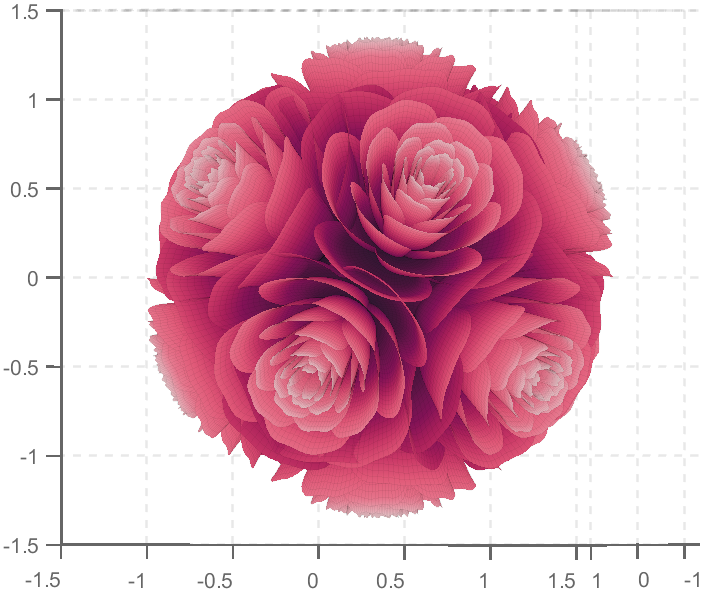
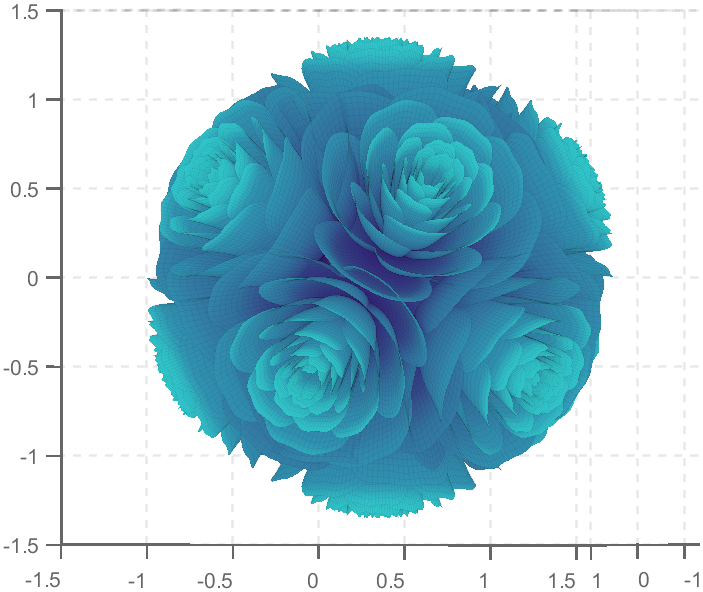
How To Draw A Rose Ball In MATLAB
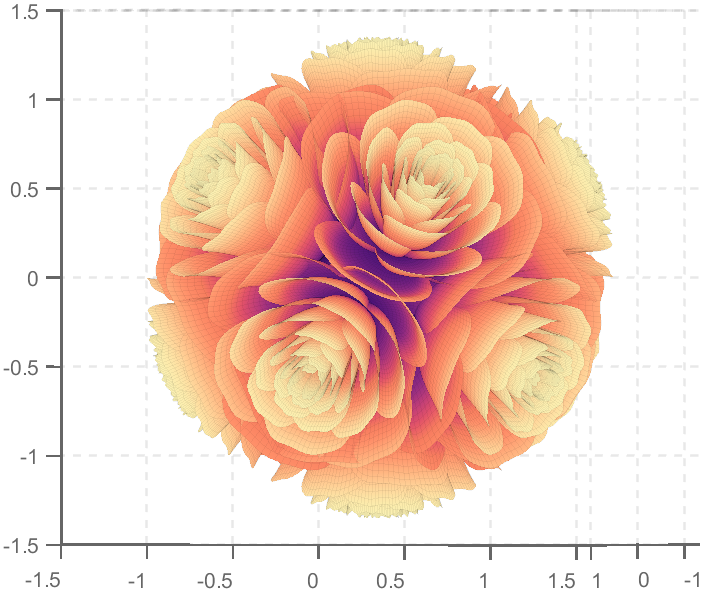
So, how to draw a roseball just like this ?
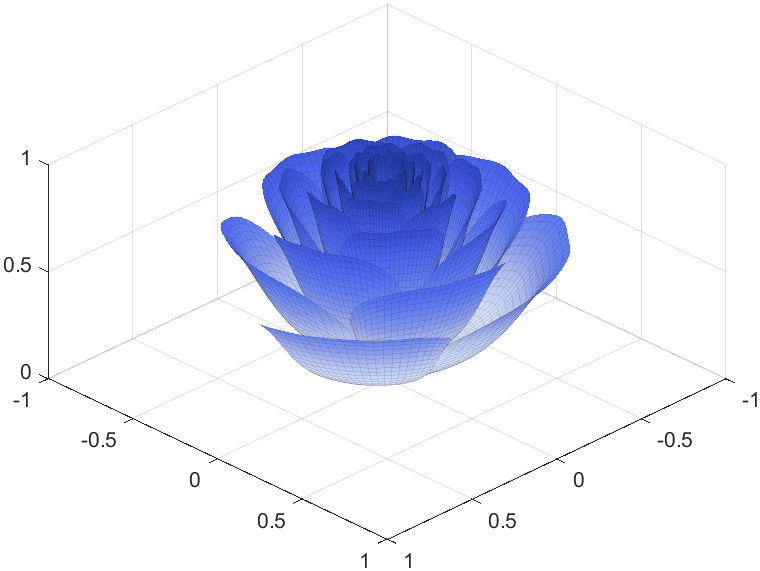
To begin with, we need to know how to draw a single rose in MATLAB:
function drawrose
set(gca,'CameraPosition',[2 2 2])
hold on
grid on
[x,t]=meshgrid((0:24)./24,(0:0.5:575)./575.*20.*pi+4*pi);
p=(pi/2)*exp(-t./(8*pi));
change=sin(15*t)/150;
u=1-(1-mod(3.6*t,2*pi)./pi).^4./2+change;
y=2*(x.^2-x).^2.*sin(p);
r=u.*(x.*sin(p)+y.*cos(p));
h=u.*(x.*cos(p)-y.*sin(p));
surface(r.*cos(t),r.*sin(t),h,'EdgeAlpha',0.1,...
'EdgeColor',[0 0 0],'FaceColor','interp')
end
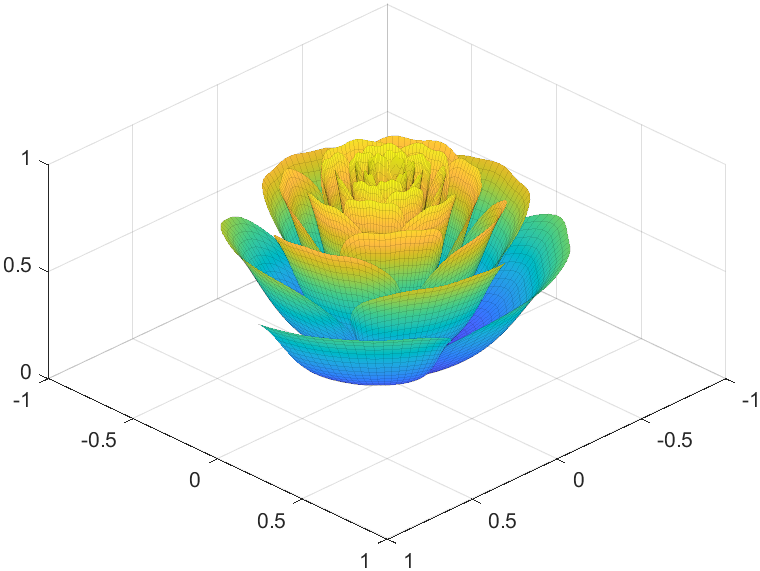
Tts pretty easy, Now we are trying to dye it the desired color:
function drawrose
set(gca,'CameraPosition',[2 2 2])
hold on
grid on
[x,t]=meshgrid((0:24)./24,(0:0.5:575)./575.*20.*pi+4*pi);
p=(pi/2)*exp(-t./(8*pi));
change=sin(15*t)/150;
u=1-(1-mod(3.6*t,2*pi)./pi).^4./2+change;
y=2*(x.^2-x).^2.*sin(p);
r=u.*(x.*sin(p)+y.*cos(p));
h=u.*(x.*cos(p)-y.*sin(p));
map=[0.9176 0.9412 1.0000
0.8353 0.8706 0.9922
0.8196 0.8627 0.9804
0.7020 0.7569 0.9412
0.5176 0.5882 0.9255
0.3686 0.4824 0.9412
0.3059 0.4000 0.9333
0.2275 0.3176 0.8353
0.1216 0.2275 0.6471];
Xi=1:size(map,1);Xq=linspace(1,size(map,1),100);
map=[interp1(Xi,map(:,1),Xq,'linear')',...
interp1(Xi,map(:,2),Xq,'linear')',...
interp1(Xi,map(:,3),Xq,'linear')'];
surface(r.*cos(t),r.*sin(t),h,'EdgeAlpha',0.1,...
'EdgeColor',[0 0 0],'FaceColor','interp')
colormap(map)
end
I try to take colors from real roses and interpolate them to make them more realistic
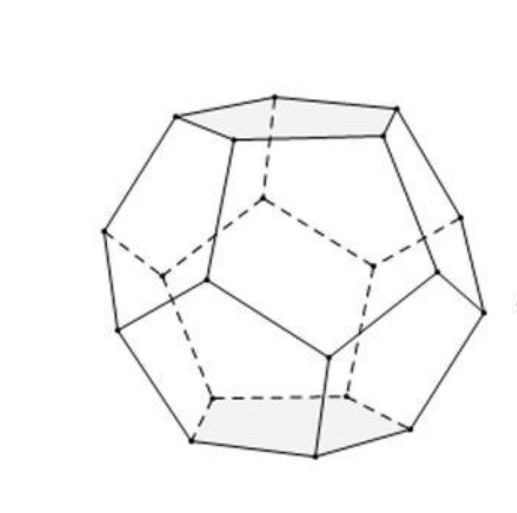
Then, how can I put these colorful flowers on to a ball ?
We need to place the drawn flowers on each face of the polyhedron sphere through coordinate transformation. Here, we use a regular dodecahedron:
Move the flower using the following rotation formula:
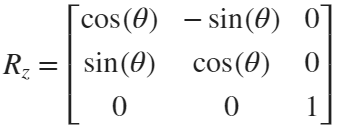
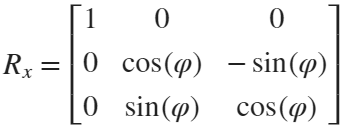
We place a flower on each plane, which means that the angle between every two flowers is 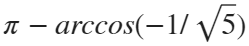 degrees. We can place each flower at the appropriate angle through multiple x-axis rotations and multiple z-axis rotations. The code is as follows:
function roseBall(colorList)
%曲面数据计算
%==========================================================================
[x,t]=meshgrid((0:24)./24,(0:0.5:575)./575.*20.*pi+4*pi);
p=(pi/2)*exp(-t./(8*pi));
change=sin(15*t)/150;
u=1-(1-mod(3.6*t,2*pi)./pi).^4./2+change;
y=2*(x.^2-x).^2.*sin(p);
r=u.*(x.*sin(p)+y.*cos(p));
h=u.*(x.*cos(p)-y.*sin(p));
%颜色映射表
%==========================================================================
hMap=(h-min(min(h)))./(max(max(h))-min(min(h)));
col=size(hMap,2);
if nargin<1
colorList=[0.0200 0.0400 0.3900
0 0.0900 0.5800
0 0.1300 0.6400
0.0200 0.0600 0.6900
0 0.0800 0.7900
0.0100 0.1800 0.8500
0 0.1300 0.9600
0.0100 0.2600 0.9900
0 0.3500 0.9900
0.0700 0.6200 1.0000
0.1700 0.6900 1.0000];
end
colorFunc=colorFuncFactory(colorList);
dataMap=colorFunc(hMap');
colorMap(:,:,1)=dataMap(:,1:col);
colorMap(:,:,2)=dataMap(:,col+1:2*col);
colorMap(:,:,3)=dataMap(:,2*col+1:3*col);
function colorFunc=colorFuncFactory(colorList)
xx=(0:size(colorList,1)-1)./(size(colorList,1)-1);
y1=colorList(:,1);y2=colorList(:,2);y3=colorList(:,3);
colorFunc=@(X)[interp1(xx,y1,X,'linear')',interp1(xx,y2,X,'linear')',interp1(xx,y3,X,'linear')'];
end
%曲面旋转及绘制
%==========================================================================
surface(r.*cos(t),r.*sin(t),h+0.35,'EdgeAlpha',0.05,...
'EdgeColor',[0 0 0],'FaceColor','interp','CData',colorMap)
hold on
surface(r.*cos(t),r.*sin(t),-h-0.35,'EdgeAlpha',0.05,...
'EdgeColor',[0 0 0],'FaceColor','interp','CData',colorMap)
Xset=r.*cos(t);
Yset=r.*sin(t);
Zset=h+0.35;
yaw_z=72*pi/180;
roll_x=pi-acos(-1/sqrt(5));
R_z_2=[cos(yaw_z),-sin(yaw_z),0;
sin(yaw_z),cos(yaw_z),0;
0,0,1];
R_z_1=[cos(yaw_z/2),-sin(yaw_z/2),0;
sin(yaw_z/2),cos(yaw_z/2),0;
0,0,1];
R_x_2=[1,0,0;
0,cos(roll_x),-sin(roll_x);
0,sin(roll_x),cos(roll_x)];
[nX,nY,nZ]=rotateXYZ(Xset,Yset,Zset,R_x_2);
surface(nX,nY,nZ,'EdgeAlpha',0.05,...
'EdgeColor',[0 0 0],'FaceColor','interp','CData',colorMap)
for k=1:4
[nX,nY,nZ]=rotateXYZ(nX,nY,nZ,R_z_2);
surface(nX,nY,nZ,'EdgeAlpha',0.05,...
'EdgeColor',[0 0 0],'FaceColor','interp','CData',colorMap)
end
[nX,nY,nZ]=rotateXYZ(nX,nY,nZ,R_z_1);
for k=1:5
[nX,nY,nZ]=rotateXYZ(nX,nY,nZ,R_z_2);
surface(nX,nY,-nZ,'EdgeAlpha',0.05,...
'EdgeColor',[0 0 0],'FaceColor','interp','CData',colorMap)
end
%--------------------------------------------------------------------------
function [nX,nY,nZ]=rotateXYZ(X,Y,Z,R)
nX=zeros(size(X));
nY=zeros(size(Y));
nZ=zeros(size(Z));
for i=1:size(X,1)
for j=1:size(X,2)
v=[X(i,j);Y(i,j);Z(i,j)];
nv=R*v;
nX(i,j)=nv(1);
nY(i,j)=nv(2);
nZ(i,j)=nv(3);
end
end
end
%axes属性调整
%==========================================================================
ax=gca;
grid on
ax.GridLineStyle='--';
ax.LineWidth=1.2;
ax.XColor=[1,1,1].*0.4;
ax.YColor=[1,1,1].*0.4;
ax.ZColor=[1,1,1].*0.4;
ax.DataAspectRatio=[1,1,1];
ax.DataAspectRatioMode='manual';
ax.CameraPosition=[-6.5914 -24.1625 -0.0384];
end

TRY DIFFERENT COLORS !!
colorList1=[0.2000 0.0800 0.4300
0.2000 0.1300 0.4600
0.2000 0.2100 0.5000
0.2000 0.2800 0.5300
0.2000 0.3700 0.5800
0.1900 0.4500 0.6200
0.2000 0.4800 0.6400
0.1900 0.5400 0.6700
0.1900 0.5700 0.6900
0.1900 0.7500 0.7800
0.1900 0.8000 0.8100
];
colorList2=[0.1300 0.1000 0.1600
0.2000 0.0900 0.2000
0.2800 0.0800 0.2300
0.4200 0.0800 0.3000
0.5100 0.0700 0.3400
0.6600 0.1200 0.3500
0.7900 0.2200 0.4000
0.8800 0.3500 0.4700
0.9000 0.4500 0.5400
0.8900 0.7800 0.7900
];
colorList3=[0.3200 0.3100 0.7600
0.3800 0.3400 0.7600
0.5300 0.4200 0.7500
0.6400 0.4900 0.7300
0.7200 0.5500 0.7200
0.7900 0.6100 0.7100
0.9100 0.7100 0.6800
0.9800 0.7600 0.6700
];
colorList4=[0.2100 0.0900 0.3800
0.2900 0.0700 0.4700
0.4000 0.1100 0.4900
0.5500 0.1600 0.5100
0.7500 0.2400 0.4700
0.8900 0.3200 0.4100
0.9700 0.4900 0.3700
1.0000 0.5600 0.4100
1.0000 0.6900 0.4900
1.0000 0.8200 0.5900
0.9900 0.9200 0.6700
0.9800 0.9500 0.7100];
2 Comments
Time Descending