Pull up a chair!
Discussions is your place to get to know your peers, tackle the bigger challenges together, and have fun along the way.
- Want to see the latest updates? Follow the Highlights!
- Looking for techniques improve your MATLAB or Simulink skills? Tips & Tricks has you covered!
- Sharing the perfect math joke, pun, or meme? Look no further than Fun!
- Think there's a channel we need? Tell us more in Ideas
Updated Discussions
- Work directly in MATLAB and Simulink Online
- Solve real-world challenges with guidance from MathWorks experts
- Connect with peers across industries
- Ask questions and get live feedback
- Beyond the Labels: Leveraging AI Techniques for Enlightened Product Choices
- A Hands-On Introduction to Reinforcement Learning with MATLAB and Simulink
- Curriculum Development with MATLAB Copilot and Generative AI
- Simscape Battery Workshop
- Generating Tests for your MATLAB code
- Hands-On AI for Smart Appliances: From Sensor Data to Embedded Code
- A Hands-On Introduction to Reduced Order Modeling with MATLAB and Simulink
- Introduction to Research Software and Development with Simulink
- Hack Your Carbon Impact: Build and Publish an Emissions Tracker with MATLAB
- How to Simulate Scalable Cellular and Connectivity Networks: A Hands-On Session


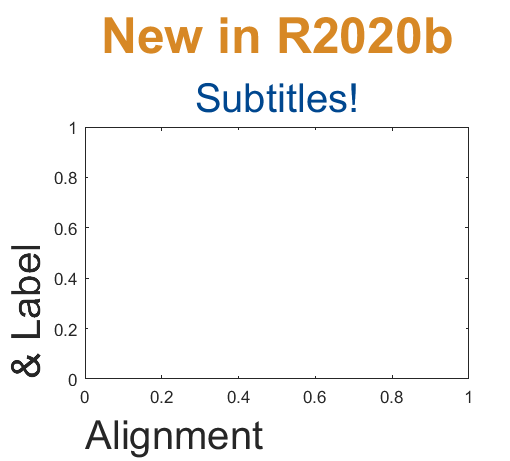
Add a subtitle
Multi-lined titles have been supported for a long time but starting in r2020b, you can add a subtitle with its own independent properties to a plot in two easy ways.
- Use the new subtitle function: s=subtitle('mySubtitle')
- Use the new second argument to the title function: [t,s]=title('myTitle','mySubtitle')
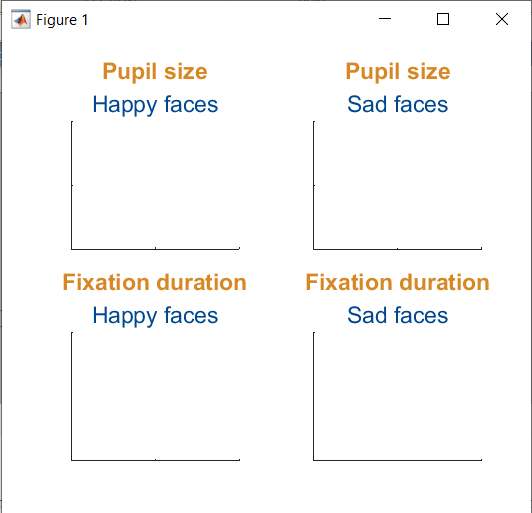
figure()
tiledlayout(2,2)
% Method 1
ax(1) = nexttile;
th(1) = title('Pupil size');
sh(1) = subtitle('Happy faces');
ax(2) = nexttile;
th(2) = title('Pupil size');
sh(2) = subtitle('Sad faces');
% Method 2
ax(3) = nexttile;
[th(3), sh(3)] = title('Fixation duration', 'Happy faces');
ax(4) = nexttile;
[th(4), sh(4)] = title('Fixation duration', 'Sad faces');
set(ax, 'xticklabel', [], 'yticklabel', [],'xlim',[0,1],'ylim',[0,1])
% Set all title colors to orange and subtitles colors to purple.
set(th, 'Color', [0.84314, 0.53333, 0.1451])
set(sh, 'Color', [0, 0.27843, 0.56078])
Control title/Label alignment
Title and axis label positions can be changed via their Position, VerticalAlignment and HorizontalAlignment properties but this is usually clumsy and leads to other problems when trying to align the title or labels with an axis edge. For example, when the position units are set to 'data' and the axis limits change, the corresponding axis label will change position relative to the axis edges. If units are normalized and the axis position or size changes, the corresponding label will no longer maintain its relative position to the axis, and that's assuming the normalized position was computed correctly in the first place.
Starting in r2020b, title and axis label alignment can be set to center|left|right, relative to the axis edges.
- TitleHorizontalAlignment is a property of the axis: h.TitleHorizontalAlignment='left';
- LabelHorizontalAlignment is a property of the ruler object that defines the x | y | z axis: h.XAxis.LabelHorizontalAlignment='left';
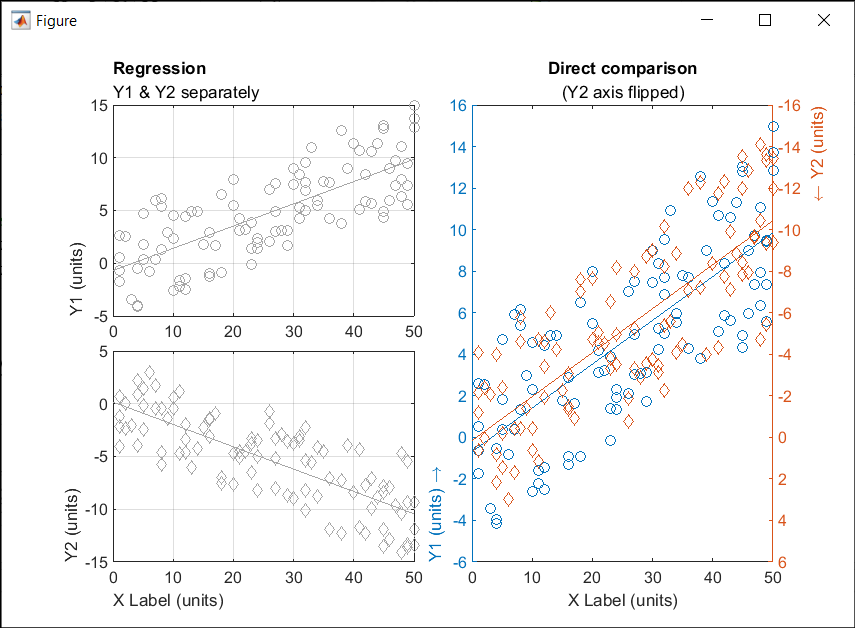
% Create data
x = randi(50,1,100)';
y = x.*[.2, -.2] + (rand(numel(x),2)-.5)*10;
gray = [.65 .65 .65];
% Plot comparison between columns of y
figure()
tiledlayout(2,2,'TileSpacing','none')
ax(1) = nexttile(1);
plot(x, y(:,1), 'o', 'color', gray)
lsline
ylabel('Y1 (units)')
title('Regression','Y1 & Y2 separately')
ax(2) = nexttile(3);
plot(x, y(:,2), 'd', 'color', gray)
lsline
xlabel('X Label (units)')
ylabel('Y2 (units)')
grid(ax, 'on')
linkaxes(ax, 'x')
%  Move title and labels leftward
set(ax, 'TitleHorizontalAlignment', 'left')
set([ax.XAxis], 'LabelHorizontalAlignment', 'left')
set([ax.YAxis], 'LabelHorizontalAlignment', 'left')
% Combine the two comparisons into plot and flip the second
% y-axis so trend are in the same direction
ax(3) = nexttile([2,1]);
yyaxis('left')
plot(x, y(:,1), 'o')
ylim([-6,16])
lsline
xlabel('X Label (units)')
ylabel('Y1 (units) \rightarrow')
yyaxis('right')
plot(x, y(:,2), 'd')
ylim([-16,6])
lsline
ylabel('\leftarrow Y2 (units)')
title('Direct comparison','(Y2 axis flipped)')
set(ax(3),  'YDir','Reverse')
% Align the ylabels with the minimum axis limit to emphasize the
% directions of each axis. Keep the title and xlabel centered
ax(3).YAxis(1).LabelHorizontalAlignment = 'left';
ax(3).YAxis(2).LabelHorizontalAlignment = 'right';
ax(3).TitleHorizontalAlignment = 'Center';       % not needed; default value.
ax(3).XAxis.LabelHorizontalAlignment = 'Center'; % not needed; default value.
- Follow the Community Guidelines: Take a moment to review our community standards. Posts that don’t follow these guidelines may be flagged by moderators or community members.
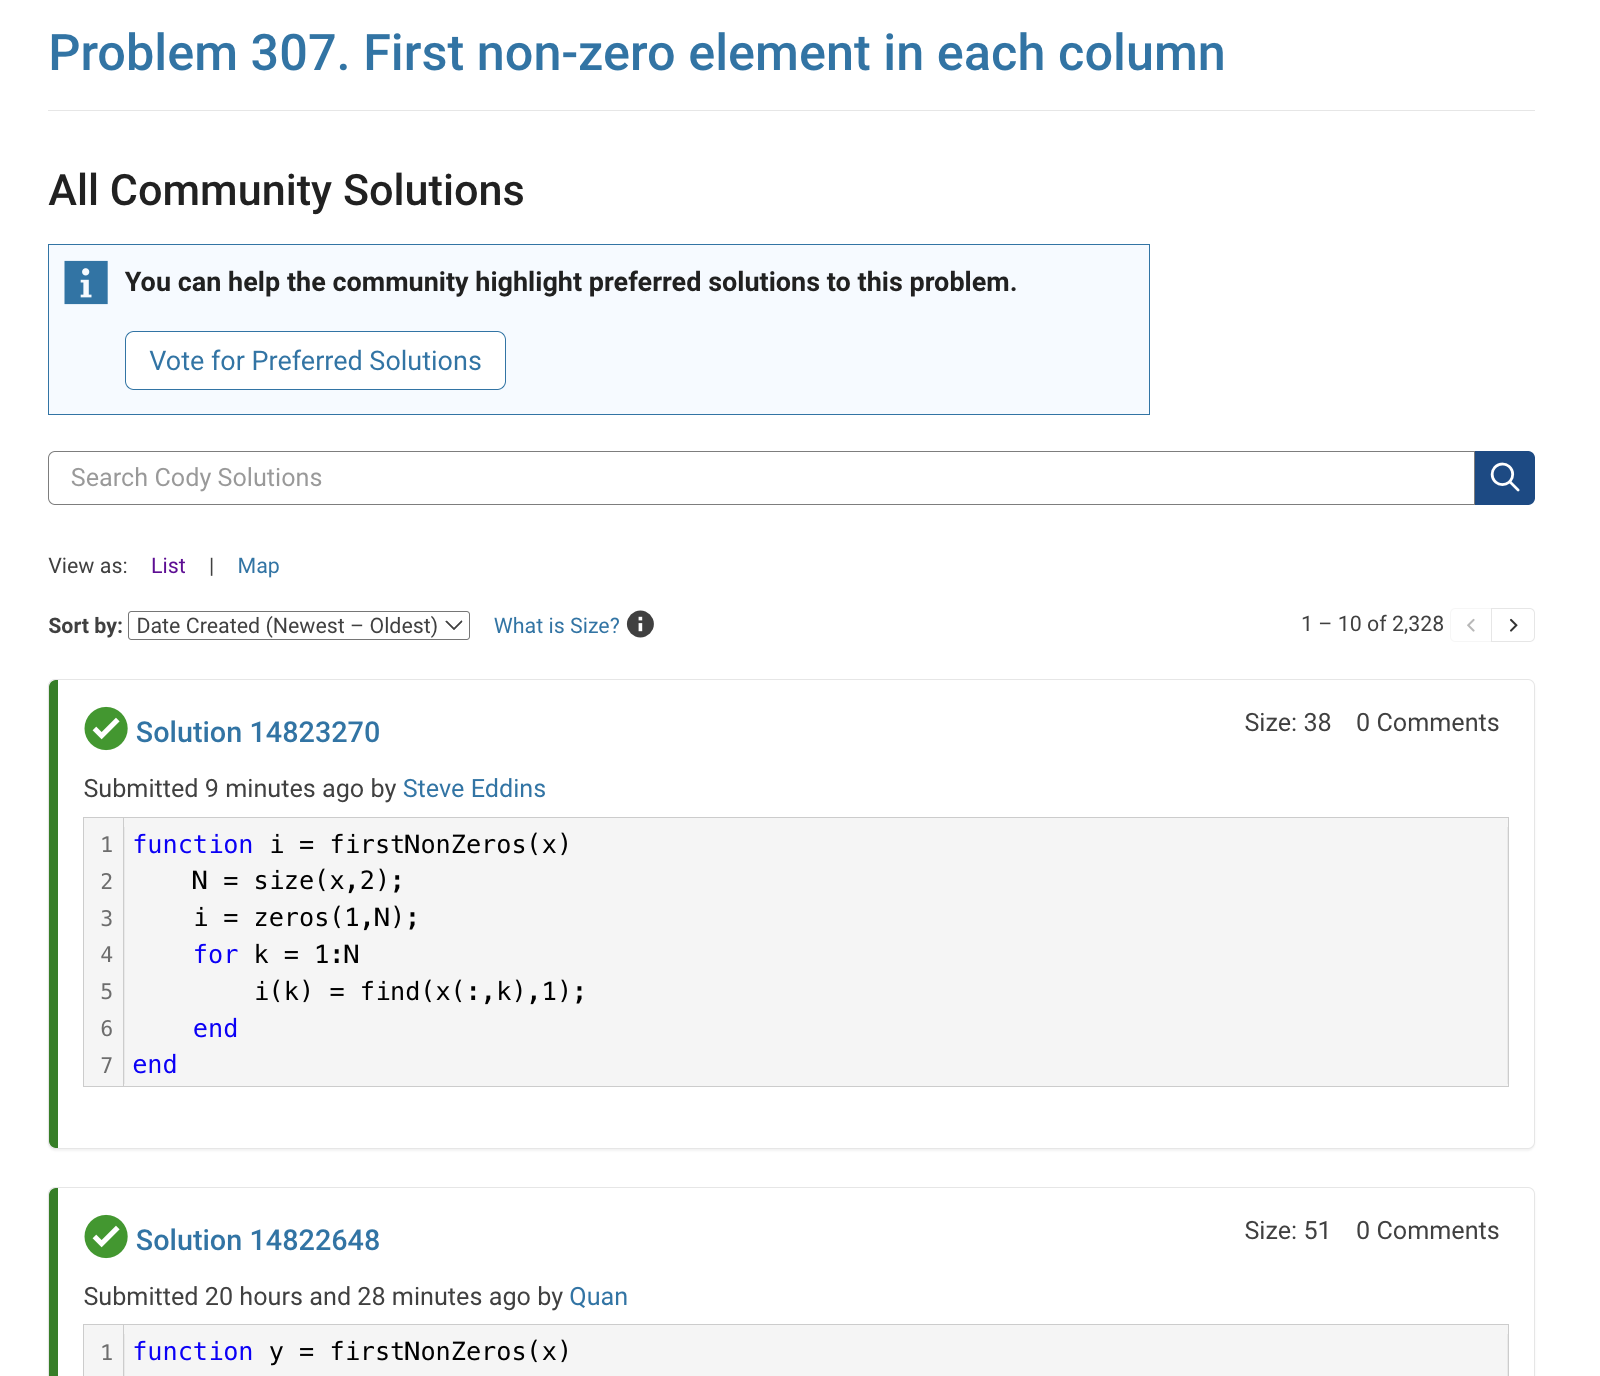
- Ask Questions About Cody Problems: When asking for help, show your work! Include your code, error messages, and any details needed to reproduce your results. This helps others provide useful, targeted answers.
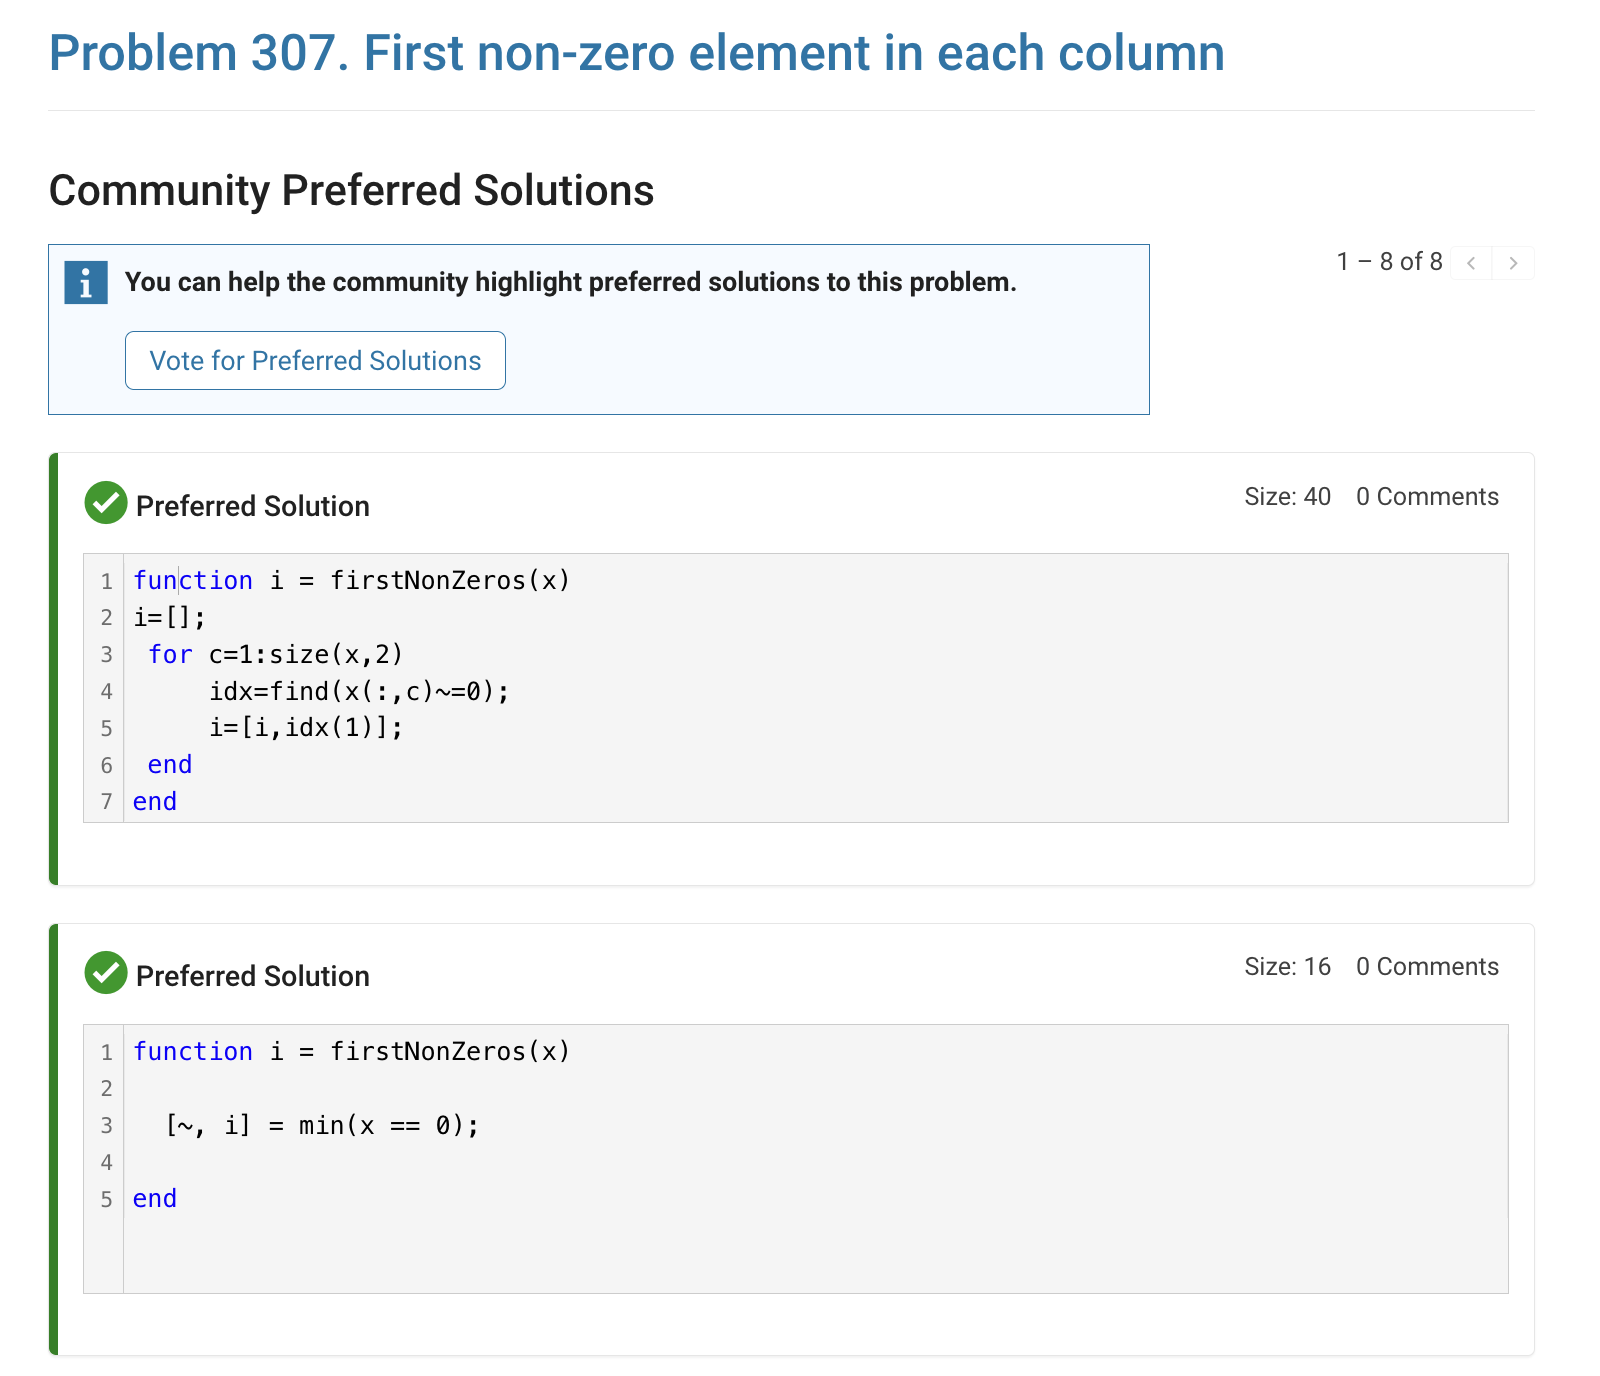
- Share Tips & Tricks: Knowledge sharing is key to success. When posting tips or solutions, explain how and why your approach works so others can learn your problem-solving methods.
- Provide Feedback: We value your feedback! Use this channel to report issues or share creative ideas to make the contest even better.
- Which one is your favorite?
- Which ones do you want to add to your collection?
- I open the MQTT Configure block.
- I fill out all the required fields — Broker address, Port, Client ID, Username, and Password.
- When I click Test Connection, it says “Connection established successfully.” So far so good.
- Then I click Apply, close the dialog, set the topic name, and try to run the simulation.
- At this point, I get the following error:Caused by: Invalid value for 'ClientID', 'Username' or 'Password'.
- When I reopen the MQTT config block, I notice that the Password field is empty again — even though I definitely entered it before and the connection test worked earlier.
- Communication systems
- Signal processing
- Mathematical modeling
- Engineering applications
- Scientific computing
- Foundation Module: MATLAB basics and fundamentals
- Image Processing: Practical applications and techniques
- Signal Processing: Analysis and implementation
- Machine Learning: ML algorithms using MATLAB
- Hands-on Learning: Projects, assignments.
- Enthusiastic educators willing to share knowledge
- Experience in any MATLAB application area
- Commitment to collaborative teaching
About Discussions
Get to know your peers while sharing all the tricks you've learned, ideas you've had, or even your latest vacation photos. Discussions is where MATLAB users connect!
More Community Areas

Ask & Answer questions about MATLAB & Simulink!

Download or contribute user-submitted code!

Solve problem groups, learn MATLAB & earn badges!

Get the inside view on MATLAB and Simulink!
Use AI to generate initial draft MATLAB code, and answer questions!