
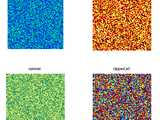
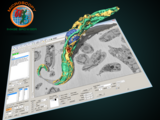
2d Image to 3D
2D to 3D:2D Input Images to 3D Model, Using MATLAB 2019b,* JPEG,JPG,TIF,DICOMRESULTS : MESH,3D POINTS,
- 222 (All time)
- 1 (Last 30 days)
- 5.0 / 5
- Community
-
24 Dec 2019
pointcloud2image( x,y,z,numr,numc )
This function converts a 3D point cloud to a 2D gray-scale raster image
This function converts a 3D point cloud to a 2D gray-scale raster image.The inputs are x,y,z coordinates of 3D points and number of rows and columns of the output image.
- 2.9K (All time)
- 1 (Last 30 days)
- 4.8 / 5
- Community
-
22 Jan 2016

Im2mesh (2D or 3D image to finite element mesh)
Generate finite element mesh based on 2D or 3D multi-phase image. For image-based finite element analysis.
element mesh based on 2D or 3D multi-phase segmented image. It provides a robust workflow capable of processing various input images, such as microstructure images of engineering materials. Due to its
- 1.7K (All time)
- 15 (Last 30 days)
- 5.0 / 5
- Community
-
13 Jun 2026
Convert 2D matrix to a 3D image matrix as used by the image processing toolbox
This code snippet converts a 2D matrix to a 3D matrix where the values in the 3rd dimension correspond to pixel intensity in the red, green, and blue domains. This is the format used by many
- 2.6K (All time)
- 1 (Last 30 days)
- 5.0 / 5
- Community
-
15 Aug 2010

Convert 2D images to 3D stl CAD model
This is a MatLab-based tool allowing to segment and generate 3D CAD model from 2D images (.bmp image formats are supported). Iso-surfaces are detected by using a cluster¬ing algorithm: the “K-Means
- 2.6K (All time)
- 1 (Last 30 days)
- 2.3 / 5
- Community
-
29 Oct 2013

Image Correlation and Convolution for Large Data
Applies a Patched Convolution Scheme to compute 2D and 3D image auto and cross correlations.
higher the winmulti, the faster the computation time (as long as you don't go out of bounds into a pagefile).There are two files to pad and element-wise multiply 2D or 3D data for use with this code called
- 447 (All time)
- 3 (Last 30 days)
- 5.0 / 5
- Community
-
23 Feb 2016

Fast Continuous Max-Flow Algorithm to 2D/3D Image Segmentation
Fast continuous max-flow algorithm to 2D/3D image segmentation developed in matlab, C and GPU
This software implements the fast continuous max-flow algorithm to 2D/3D image segmentation. It provides three implementations: matlab, C and GPU (cuda based). All the source files are provided. So
- 5.4K (All time)
- 2 (Last 30 days)
- 4.9 / 5
- Community
-
16 Dec 2011

Fast Continuous Max-Flow Algorithm to 2D/3D Multi-Region Image Segmentation
It implements the fast continuous max-flow algorithm to 2D/3D multi-region image segmentation.
This software implements the fast continuous max-flow algorithm to 2D/3D multi-region image segmentation (Potts model). It provides three implementations: matlab, C and GPU (cuda based). All the
- 4.1K (All time)
- 3 (Last 30 days)
- 5.0 / 5
- Community
-
16 Dec 2011
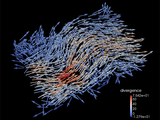
vtkwrite : Exports various 2D/3D data to ParaView in VTK file format
Exports 2D/3D image volume, vector field, surface, lines, polygons, etc. to ParaView
file named 'matlab_export.vtk' is saved and passed on to ParaView.Example 2 : export 3D vector and scalar fieldload wind [cu,cv,cw] = curl(x, y, z, u, v, w); div = divergence(x, y, z, u, v, w
- 12.2K (All time)
- 5 (Last 30 days)
- 4.9 / 5
- Community
-
3 Oct 2016

TomoPhantom is a toolbox to generate customisable 2D and 3D phantoms for image processing tasks
modular approach to build customisable 2D/3D/4D phantoms consisting of piecewise-constant and also smooth analytical objects. The objects include: Gaussians, parabolas, ellipses, cones, rectangulars, etc
- 824 (All time)
- 2 (Last 30 days)
- 4.5 / 5
- Community
-
22 Dec 2023
Extract 2D images from 3D volume image data
This m-script slices 3D image file in MovingMask.raw in 2D images.
This may be useful when you are processing3D images for 2D image registration for e.g. landmark-based thin plate spline etc.
- 558 (All time)
- 1 (Last 30 days)
- 5.0 / 5
- Community
-
28 Mar 2012
2D/3D specific surface of porous media using 2D images
This code calculates 2D/3D specific surface of porous media using 2D images
2D/3D specific surface of porous media using 2D imagesSpecific surface of the porous media has two different definitions:1-3-D Specific surface of the void/porous space, which is equal to the surface
- 944 (All time)
- 4 (Last 30 days)
- 5.0 / 5
- Community
-
9 Feb 2021
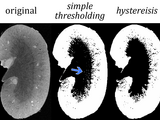
Hysteresis thresholding for 3D images (or 2D)
Segments images based dual thresholding with 2D or 3D connectivity neighborhoods.
segmentation with fewer isolated pixels. The function help is included below: Hysteresis3d is a simple function that performs trinarisation and hysteresis for 2D and 3D images. Hysteresis3d was inspired by
- 2.5K (All time)
- 1 (Last 30 days)
- 4.6 / 5
- Community
-
9 Dec 2013
InSPIRE -- 2D to 3D Conversion for further image analysis
InSPIRE -- Utility for stacking cross-sectional 2D images into 3D, then display in orthogonal planes
It is useful for visualization and image registration. This code stacks 2D images into a 3D volume. It then resample user specified plane to obtain orthogonal image plane for 2D image processing and
- 674 (All time)
- 1 (Last 30 days)
- 3.0 / 5
- Community
-
29 Mar 2012

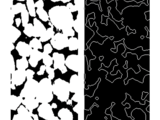
2D/3D image segmentation toolbox
2D/3D image segmentation using level-set based active contour/surface with AOS scheme
segmentation.(3)All the methods can be applied to 2D and 3D data.
- 35.3K (All time)
- 3 (Last 30 days)
- 4.5 / 5
- Community
-
28 Jan 2013
Affine translates a 2D image or 3D volume.
This function makes it easy to translate a 2d image or 3d volume. The shifts do not need to be integer values. It was written so I could test image registration algorithms.Help:function Iout =
- 3.4K (All time)
- 1 (Last 30 days)
- 5.0 / 5
- Community
-
15 Apr 2010

For a better comprehension of how interact noises with 2D and 3D images and how to filter them.
This is a GUI interface in MATLAB which works with all operating system.It is a good exemple of how to set up an interface with MATLAB.All the information about how to use it are in the README.txt
- 876 (All time)
- 1 (Last 30 days)
- -- / 5
- Community
-
7 Jun 2013
Converts an array of double (2D or 3D) to an RGB image using specified colormap
Computes the min and max values within the input array, convert to 256 values, and apply a colormap to produce a color image (RGB).It is possible to specifies the range of values to consider, as well
- 1.6K (All time)
- 1 (Last 30 days)
- 3.8 / 5
- Community
-
2 Feb 2011

A simple function for displaying 3-d arrays similar to how image() can be used for 2-d arrays.
I use image() a lot for quickly getting an overview of what a 2-d array contains. I have searched through the Volume visualization guides without finding anything similar for 3-d arrays, so I have
- 1.1K (All time)
- 1 (Last 30 days)
- 4.5 / 5
- Community
-
11 Mar 2011
MATLAB client library for Steno3D
Steno3D is an online platform to bring 3D visualization and collaboration into the cloud. The MATLAB client library allows seamless integration with Steno3D and your MATLAB plotting workflow. Upload
- 110 (All time)
- 1 (Last 30 days)
- 5.0 / 5
- Community
-
17 Apr 2017

Areal, volumetric and textural parameters from 2D and 3D images
GUI for calculating metrics from 2D and 3D images.
in "Fundamentals of biofilm research" 2013, CRC Press Content, Zbigniew Lewandowski, Haluk Beyenal andComputation of Minkowski measures on 2D and 3D binary images Image Anal. Stereol., 2007, 26
- 1.4K (All time)
- 2 (Last 30 days)
- 3.7 / 5
- Community
-
26 Nov 2014

This example shows how-to train and generates 2D images using a minimal implementation of 3D Gaussian splatting using Deep Learning Toolbox.
This example shows how-to train and generates 2D images using a minimal implementation of 3D Gaussian splatting using Deep Learning Toolbox. It includes Frustum culling, pruning and densification
- 26 (All time)
- 5 (Last 30 days)
- -- / 5
- Community
-
2 Feb 2026
MIP, Color, Slice and Shaded 3D (shearwarp) Volume Rendering, interactive 3D view/measurement GUI
kind of renders. The fast render algorithm which renders a 3D volume to a 2D image, is based on a Matlab coded implementation of the Shear-Warp transform, in which instead of rotating the viewer rays the
- 56.9K (All time)
- 11 (Last 30 days)
- 4.8 / 5
- Community
-
15 Sep 2016

Project 3D into 2D image coordinates using a camera model
Project 3D points using a camera model with lens distortion parameters
Code for finding the location of 3D points in a camera's image coordinates. Takes into account the cameras transformation matrix, camera matrix and distortion coefficients.
- 2.2K (All time)
- 1 (Last 30 days)
- 4.6 / 5
- Community
-
16 Dec 2014

Multiecho enhancement for 2D/3D (N-D) images
Enhances images using a weighted sum or MEFIC.
Multi Echo Fourier Image Contrast (MEFIC) technique for 2D, 3D or N-D images. The enhancement is taken along the last dimension of the image (e.g., along the echo time for for a multiecho MRI image). For
- 761 (All time)
- 2 (Last 30 days)
- 5.0 / 5
- Community
-
27 Jan 2014
Quickly and easily create 2d and 3d plots of fMRI data.
generating 2- or 3-dimensional plots of fMRI data that can be manipulated (e.g. rotated, modified) in real time.Although these tools may be used to produce publication-quality figures, the focus here is on
- 2.9K (All time)
- 1 (Last 30 days)
- 5.0 / 5
- Community
-
17 Jan 2017
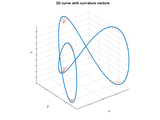
Curvature of a 1D curve in a 2D or 3D space
Calculates the local radius of curvature as well as the cumulative arc length and the curvature vector along a 1D curve in 2D or 3D space
Function circumcenter finds the radius R and the center of the circumscribed circle of a triangle in 3D space. Function curvature calls circumcenter for every triplet , , of neighboring points along
- 5.7K (All time)
- 5 (Last 30 days)
- 4.8 / 5
- Community
-
10 Nov 2021
Add colored markers to an image, that can be 2D or 3D, grayscale or color.
Add a colored layer to a base image, whatever the dimension (2D or 3D) and the type (grayscale of color) of the base image.Overlays are given by pairs MASK + color. The mask is a binary image the
- 1.2K (All time)
- 1 (Last 30 days)
- -- / 5
- Community
-
24 Sep 2010

Geodesic distances and geodesic diameters within 2D/3D images
Propagates geodesic distances in binary or label images, and computes geodesic diameter
Contains several functions for propagating chamfer distances (approximation of euclidean distances) within binary images or label images.Contains also some functions for computing geodesic distances
- 1.8K (All time)
- 2 (Last 30 days)
- 5.0 / 5
- Community
-
20 Dec 2017
Export figure to 3D interactive PDF
Export figure as U3D file or directly to 3D interactive graphics within PDF.
can be found here: http://www.ctan.org/tex-archive/macros/latex/contrib/media9For PDF readers which do not render 3D figures, it is possible to include an alternative 2D image as a substitute to the
- 10.8K (All time)
- 7 (Last 30 days)
- 4.2 / 5
- Community
-
4 Aug 2021
colormapline - color-changing 2D or 3D line
Plot a 2D or 3D line using a specified colormap.
% H = colormapline(X,Y,Z,C) Plot a line using a specified colormap% If Z is given, a 3D plot with coordinates X, Y, Z is created.% If Z is not given, a 2D plot of Y over X if created.% If Y and
- 1.9K (All time)
- 1 (Last 30 days)
- 5.0 / 5
- Community
-
14 Dec 2016
Scalable Vector Graphics (SVG) Export of Figures
Converts 3D and 2D MATLAB plots to the scalable vector format (SVG).
Scalable Vector Graphics (SVG) Export of FiguresConverts 2D & 3D Matlab plots to the scalable vector format (SVG). This format is specified by W3C (http://www.w3.org) and can be viewed and
- 50.7K (All time)
- 16 (Last 30 days)
- 4.6 / 5
- Community
-
23 Apr 2021
Equivalent ellipsoid from 3D image
the 2D image or labels, and returns the associated equivalent ellipse. The function "drawEllipse" can be used to display result.The package includes functions from the geom2d and geom3d contributions
- 1.5K (All time)
- 1 (Last 30 days)
- 5.0 / 5
- Community
-
28 Aug 2019

Augmented Lagrangian Digital Image Correlation and Tracking
2D-AL-DIC(Augmented Lagrangian DIC) is a fast, parallel-computing DIC algorithm which also considers global kinematic compatibility.
, March 6). 2D_ALDIC (Version 3.3). CaltechDATA. https://data.caltech.edu/records/1443% =========================================[3] Yang, J. and Bhattacharya, K. Combining Image Compression with Digital
- 4.1K (All time)
- 14 (Last 30 days)
- 5.0 / 5
- Community
-
26 Mar 2024

Diffeomorphic Log Demons Image Registration
Simple matlab code for 2D and 3D image registration using the diffeomorphic log-demons algorithm
Simple matlab code for 2D and 3D image registration using the diffeomorphic log-demons algorithmCode is provided in order to help the understanding of the Demons algorithm - Any comment or
- 4.2K (All time)
- 1 (Last 30 days)
- 5.0 / 5
- Community
-
19 Aug 2014

RBF or Thin-Plate Splines Image Warping
Radial basis function/Thin-plate spline function and demo for 2D image warping.
Radial basis function/Thin-plate spline 2D image warping. [imo,mask] = rbfwarp2d( im, ps, pd, method) input: im: image 2d matrix ps: 2d source landmark [n*2] pd: 2d destin
- 734 (All time)
- 4 (Last 30 days)
- 5.0 / 5
- Community
-
6 Nov 2015
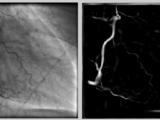
Hessian based Frangi Vesselness filter
Enhancement of Vessel/ridge like structures in 2D/3D image using hessian eigen values
supports both 2D images and 3D volumes.The 3D method contains an c-code file which can calculate fast the eigenvectors and eigenvalues of a list of image Hessians. First compile this code with "mex
- 29.8K (All time)
- 28 (Last 30 days)
- 4.7 / 5
- Community
-
2 Mar 2010
- 1.7K (All time)
- 3 (Last 30 days)
- 5.0 / 5
- Community
-
12 Jun 2019
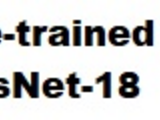
Pre-trained Neural Network Toolbox Model for 3D ResNet-18 Network
To transfer the learnable parameters from pre-trained 2D ResNet-18 (ImageNet) to 3D one, we duplicated 2D filters (copying them repeatedly) through the third dimension. This is possible since a video
- 2.1K (All time)
- 18 (Last 30 days)
- 5.0 / 5
- Community
-
6 May 2021
Finite Element Analysis (FEA) of 2D and 3D Truss Structure
To plot the Stress and Deformation in 2D or 3D Truss using FEM.
The code is used for plotting the Stress and Deformation in 3D Truss using FEM, Please read the ReadMe file, download link - https://drive.google.com/open?id=121q0g4TcCo8d
- 3.6K (All time)
- 11 (Last 30 days)
- 4.9 / 5
- Community
-
3 Jul 2020

Extracting 3D Parametric Curves from 2D Images of Helical Objects
Accompanying code for "Extracting 3D Parametric Curves from 2D Images of Helical Objects", Sept 2016
This repository provides a MATLAB implementation for extracting a 3D parametric curve from a 2D image of a helical object. It also contains functions to "unwrap" or "straighten" images of curve-like
- 76 (All time)
- 1 (Last 30 days)
- -- / 5
- Community
-
1 Aug 2017

GPU Centerline Extraction (Skeletonization) in 2D or 3D
Extracts the centerlines (skeleton) of binary 2D images or 3D volumes using bit encoded thinning on the GPU.
, Journal of Real-Time Image Processing). The library take binarized 2D images or 3D volumesand generates a list of curvilinear segments representing the centerlines. The code is free to use for research
- 825 (All time)
- 4 (Last 30 days)
- 5.0 / 5
- Community
-
14 Aug 2020
Plot images as 3D planes with full control over position and scale.
This function will display an image in a 3D plane with the specified position, image normal, image x direction and scale. It can display full colour and monochrome images with or without
- 2.7K (All time)
- 2 (Last 30 days)
- 5.0 / 5
- Community
-
12 Feb 2013
Microscopy Image Browser (MIB)
MIB is a package for segmentation of multi-dimensional (2D-4D) microscopy datasets
herehttp://se.mathworks.com/matlabcentral/fileexchange/63402-microscopy-image-browser-2--mib2-With MIB you can analyse, segment and visualize various multidimensional datasets from both light and electron microscopy. See more further details and tutorials on MIB website
- 1.3K (All time)
- 5 (Last 30 days)
- 5.0 / 5
- Community
-
9 Feb 2019
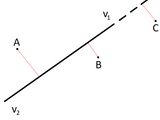
calculate the distance between a 2D or 3D line and one or more points
You can input either a 2D or a 3D line and 2D or 3D points. This function is an extended version of the line below, with some input checking:distance=norm(cross(v1-v2,pt-v2))/norm(v1-v2)Licence: CC
- 2.4K (All time)
- 2 (Last 30 days)
- 4.8 / 5
- Community
-
5 Jul 2020
3 programs 1.3d image from slices 2.plots random subplot images 3.color image to black and white
1. creates a 3d image with different slices. The person running it will need to create a cell of all the slices. 2. plots two images from a group that is created by the person running it. 3. converts
- 155 (All time)
- 1 (Last 30 days)
- -- / 5
- Community
-
20 Jan 2012

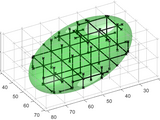
The program plots convex linear closed regions in 2D/3D.
The program plots convex linear closed regions in 2D/3D. The region is a subset of R2 or R3 such that Ax>=b and lb<=x<=ub. It is also possible to plot points in the same plot.(See help
- 16.8K (All time)
- 3 (Last 30 days)
- 4.6 / 5
- Community
-
24 Jun 2025

Fast Gaussian filtering of 1D, 2D greyscale / color image or 3D image volume.
IMGAUSSIAN filters an 1D, 2D color/greyscale or 3D image with a Gaussian filter. Instead of using a multidimensional Gaussian kernel, it uses the fact that a Gaussian kernel can be separated in 1D
- 5.2K (All time)
- 3 (Last 30 days)
- 5.0 / 5
- Community
-
1 Oct 2009

EDFI is a script to extract data from an 2D or 3D image.
EDFI is a script to extract data from an 2D or 3D image. EDFI is developed using MATLAB and these steps below:1. Load image.2. Get data from image.3. Plot result.
- 64 (All time)
- 1 (Last 30 days)
- -- / 5
- Community
-
14 Sep 2022
Gaussian Pyramid - Expand and Reduce routines 1D, 2D and 3D
This contains set of routines, for the 'expand' and 'reduce' operations of Gaussian Image Pyramids f
images, and they were relatively slow.I have improved both functions to make them working for 1D, 2D and 3D images. Output images will havethe same data type of the original image, and both functions are
- 6.5K (All time)
- 1 (Last 30 days)
- 4.8 / 5
- Community
-
24 Aug 2006

Draw a colored line in 2D or 3D
z-valuescdata (opt.): vector with color-data2 input arguments => cdata = y; z=0 3 input arguments => cdata = z 4 i.a. & z = [] => cdata = y; z=0 OUPUT=====h: Handle to line
- 6.5K (All time)
- 1 (Last 30 days)
- 4.8 / 5
- Community
-
16 Apr 2007
Measure of geometric parameters in 2D or 3D images (surface area, perimeter, Euler Number...)
Contains various functions for measuring or estimating geometric quantities from 2D or 3D images.Parameters available for 2D images are:* the area (number of pixels)* the perimeter (based on Crofton
- 4.6K (All time)
- 3 (Last 30 days)
- 4.9 / 5
- Community
-
11 Jan 2021

3D sample reconstruction from its 2D hologram multislicing
(1) simulation of hologram of a 3D sample, (2) reconstruction of 3D sample from its 2D hologram, (3) iterative reconstruction of 3D sample
These MATLAB codes (1) simulate hologram of a 3D sample, (2) reconstruct 3D sample from its 2D hologram, (3) iteratively reconstruct artefact-free 3D sample from its 2D hologram as described in
- 337 (All time)
- 4 (Last 30 days)
- 5.0 / 5
- Community
-
26 Feb 2022
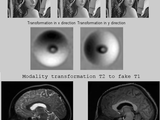
multimodality non-rigid demon algorithm image registration
non-rigid 2D and 3D image registration with demon (fluid) algorithm, extended with modality transf.
This function will perform demon registration which is an type of fast non-rigid fluid like registration between two 2D or 3D images. Registration between different (MRI) modalities is also
- 24.8K (All time)
- 7 (Last 30 days)
- 4.7 / 5
- Community
-
3 Jun 2010
Draw 2D or 3D color streamlines.
STREAMCOLOR(X,Y,U,V,STARTX,STARTY,VMAG) or STREAMCOLOR(X,Y,Z,U,V,W,STARTX,STARTY,STARTZ,VMAG) creates streamlines from 2D or 3D vector data U,V,W. The arrays X,Y,Z define the coordinates for U,V,W
- 3.3K (All time)
- 3 (Last 30 days)
- 5.0 / 5
- Community
-
8 May 2009
2D and 3D Phase Unwrapping using SRNCP
2D & 3D phase unwrapping plugins for Matlab
These files provide a means to implement the above algorithm without any special packages/toolboxes and needs any Matlab compatible C++ compiler (used Visual Studio 2019 version for this).To
- 1.8K (All time)
- 5 (Last 30 days)
- 5.0 / 5
- Community
-
3 Jun 2020
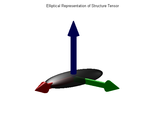
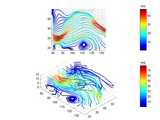
structure tensor - introduction and tutorial
Comprehensive intro to structure tensors both in 2D and 3D
Tutorial on structure tensors. Normally associated with image processing and structure inference, this code provides a completely encapsulated package to explain and demonstrate the use of structure
- 9.2K (All time)
- 3 (Last 30 days)
- 5.0 / 5
- Community
-
1 Nov 2006
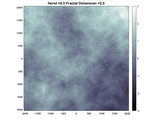
Create, Measure, Characterize, Visualize 1D, 2D, 3D Fractals
Creation of fractal curves, surfaces, & volumetric density as well as techniques to measure 1D, 2D, and 3D fractal dimension and fractalness
Midpoint Displacement Method (original algorithm for 3D and 2D)Fractal Zooming of images Infinite Fractal Zooming of Fractal SurfacesSpectral Synthesis of 1D, 2D, and 3D fractalsMeasure Fractal
- 721 (All time)
- 4 (Last 30 days)
- 5.0 / 5
- Community
-
22 Mar 2021

MATLAB toolbox implementing Convolutional Neural Networks (CNN) for 2D and 3D inputs
accuracy as in the 2d demo This framework was used in a project classifying Vertebra in a 3D CT images.=~=~=~=~=~=~=~=~=~=~=~=~=~=~=~=~=~=~=~=~To run MNIST demo: Go into the folder 'Demo/MNIST', Run
- 3.6K (All time)
- 4 (Last 30 days)
- 4.9 / 5
- Community
-
10 Dec 2018

Quiver - magnitude-dependent color in 2D and 3D
Implements the MATLAB given quiver/quiver3 function adding a color coding depending on magnitude
%quiverC3D creates a 3D quiver plot and adds a color coding. The color coding is%given by the magnitudes of the component vectors. Large values result in colors %from the upper end of the used
- 3.8K (All time)
- 4 (Last 30 days)
- 4.6 / 5
- Community
-
2 Nov 2021