10,467 results
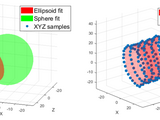
A tool set for fitting and/or plotting various conics and quadric surfaces, e.g., ellipses, cylinders, spheres, planes, cones, and lines.
This FEX submission offers a tool set for fitting and plotting 2D conics (ellipses, circles, lines,...) as well as 3D quadric surfaces (ellipsoids, spheres, planes, cylinders, cones,...). Each type

Adds ellipses to the current plot
Adds ellipses to the current plot. The ellipses are specified by the semimajor axis radius, the semiminor axis radius, the orientation of the semimajor axis with an angle from the x-axis, and the

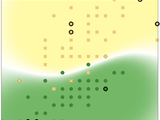
plot_ellipse simply plots an ellipse arround scattered points with 95% confidence interval.
plot_ellipse simply plots an ellipse arround scattered points with 95% confidence interval.The code based on Ohad Gal fit_ellipse (2003)Format: handle_ellipse = plot_ellipse( x,y ) Input
linear multivariate statistics
statistical toolbox including n-way ANACOVA and n-way MANOVA as well numerous diagnostic plots. There is also support for multiple responses and linstats efficiently supports fiting models with up to 100s of

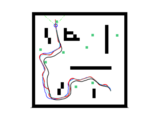
SLAM navigation using an Lidar Sensor and Corner Extraction

ELLIPSE plots an ellipse, and returns its values using 3 points selected by the user on the figure.
window is just a flat line.During the code development, I was assisted by Roger Stafford's answer and Wikipediahttp://www.mathworks.com/matlabcentral/answers/86615-how-to-plot-an-ellipse

Draws 2D and 3D ellipses that are given in "center form".
Ellipse_plot(A,c)This function draws an N-dimensional ellipse (N = 2,3) that is given in "center form":(x - C)' A (x - C) <= 1where C is the center of the ellipse, and A is an NxN positive

Spatial math primitives for MATLAB

Generates Abaqus mesh for 2D mesoscale geometries
Ellipsoids=Particles_Distribution(Classes,x,y,z,er)Generates aggregate with ellipsoids shapes4-function Plot_Ellipsoids(Ellipsoids,x,y,z)Plots ellipsoids5-function Ellipses=Ellipsoids_to_Ellipses(Ellipsoids,dist,r_min)Converts ellipsoids to ellipses. used for

Aggregate packing generator with fibers used for the simulation of aggregate and fibers in composites
Ellipses=Ellipsoids_to_Ellipses(Ellipsoids,dist,r_min)Converts ellipsoids to ellipses. used for 2D analysis6-function Plot_Ellipses(Ellipses,x,z)Plots ellipses7-function [Nodes_Fibers, Fibers]=Generate_Fiber(x,y,z,L,N,DFiber,Orientation,Ndiv,Ellipsoids)Generate

Aggregate packing generator used for the simulation of aggregate in composites
aggregate with ellipsoids shapes4-function Plot_Ellipsoids(Ellipsoids,x,y,z)Plots ellipsoids5-function Ellipses=Ellipsoids_to_Ellipses(Ellipsoids,dist,r_min)Converts ellipsoids to ellipses. used for 2D
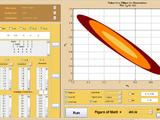
General Fisher Matrix Toolbox and GUI


Plot an error ellipse depicting confidence interval given a covariance matrix.
% ERROR_ELLIPSE - plot an error ellipse, or ellipsoid, defining % confidence region% ERROR_ELLIPSE(C22) - Given a 2x2 covariance matrix, plot the% associated error ellipse, at the origin. It
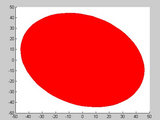
Plots a filled ellipse in a certain orientation using Matlab's 'patch'.
function plot_ellipse(a,b,cx,cy,angle,color)%a: width in pixels%b: height in pixels%cx: horizontal center%cy: vertical center%angle: orientation ellipse in degrees%color: color code (e.g., 'r' or

Slam using an Differential Robot with an Laser Sensor To Map Beacons over an area.
Pattern recognition lab, an image classification toolbox using Knn classifier and corss-validation.

Trainable COSFIRE filters for keypoint detection and pattern recognition
Version 1.11
George AzzopardiA COSFIRE filter detects features or patterns of interest, e.g. traffic signs in complex scenes.

This MATLAB code allows you to perform gender recognition from face images for a given dataset.

ParaPIV is a parallel version PIVlab for Particle Image Velocimetry (PIV) post-processing.
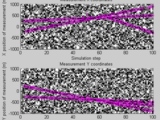
MATLAB Live Scripts and slides intended to be used as learning support material to teach mobile robot localization and Kalman Filter.
), GitHub. Retrieved June 29, 2021.AJ Johnson (2021). error_ellipse (https://www.mathworks.com/matlabcentral/fileexchange/4705-error_ellipse), MATLAB Central File Exchange. Retrieved October 31, 2021.ROS

Plasticity Model with multi-yield surfaces.
Implementation of the Gaussian mixture probability hypothesis density filter GM-PHD.

Trainable COSFIRE filters for curvilinear structure delineation in images
Version 1.4.0.0
Nicola StrisciuglioB-COSFIRE filters detect line at different orientations by combining the responses of DoG filters.
Draw ellipse using major, minor, inc and phase.
It is common to find routines to plot ellipses without the ellipse phase angle parameter.Phase angle provides important information in many applications...This function also allows ellipse to be
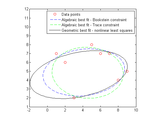
Fit ellipses to 2D points using linear or nonlinear least squares
) can be used to plot the fitted ellipses
Free pattern recognition toolbox for MATLAB
Toolbox for angle, coordinate and date conversions and transformations. Version 2.99.
Computes error ellipsoid semi-axes, azimuths, inclinations plterrel - Plots error ellipse for covariance matrixMiscellaneous cart2euler- Converts Cartesian coordinate rotations to Euler pole rotation
Piotr's Image & Video Matlab Toolbox
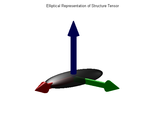
Comprehensive intro to structure tensors both in 2D and 3D

Generates the coordinates of an ellipse in 3D space and can optionally plot it.
%% Definition%% Ellipse3D generates a three row, single column vector that holds the% coordinates of an ellipse in 3D space and can optionally plot it.%% Generation of the ellipse coordinates occurs
The code calculates a metric between a pair of multivariate Gaussian Mixture Models.
Motion Planning in Belief Space using iLQG

Plots ellipses
Plots ellipsesfunction Plot_Ellipses(Ellipses)%Input%Ellipses: (N*5) array. each column represent: %(:,1): radius of ellipses at direction 1 %(:,2): radius of ellipses at direction 2 %(:,3
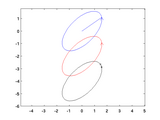
plot rotating ellipse
The code plot & create a movie of rotating ellipse
A GNSS multipath simulator in Matlab/Octave

Provide 2D and 3D spatial math primitives for MATLAB.

Aggregate packing generator with fibers used for the simulation of aggregate and fibers in composites. It also creates three STL files.
Ellipsoids=Particles_Distribution(Classes,x,y,z,er)Generates aggregate with ellipsoids shapes4-function Plot_Ellipsoids(Ellipsoids,x,y,z)Plots ellipsoids5-function Ellipses=Ellipsoids_to_Ellipses(Ellipsoids,dist,r_min)Converts ellipsoids to ellipses. used for
Core tools required for running Canlab Matlab toolboxes. The heart of this toolbox is object-oriented tools that enable interactive analysis
JAABA: The Janelia Automatic Animal Behavior Annotator

Aggregate packing generator used for the simulation of aggregate in composites and creates STL file
shapes4-function Plot_Ellipsoids(Ellipsoids,x,y,z)Plots ellipsoids5-function Ellipses=Ellipsoids_to_Ellipses(Ellipsoids,dist,r_min)Converts ellipsoids to ellipses. used for 2D analysis6-function
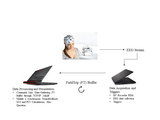
EEG brain-computer interface system for providing real-time speech entrainment neurofeedback
Toolbox for classification of animal behavior in video
Illumination estimation from a single image (ICCV'09 and IJCV'12)
Consists of two tidal ellipse conversion programs
Consists of two tidal ellipse conversion programsTested under MATLAB Version 5.3.1.29215a (R11.1) on SOL2.

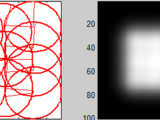
plot ellipse binary image
imgH = 512;imgW = 1024;ellipseBwImg = [];ellipseBwImg = Utility.getEllipseBwImg(imgH, imgW, 256, 512, 64, 128, 15, ellipseBwImg);ellipseBwImg = Utility.getEllipseBwImg(imgH, imgW, 128, 256, 32, 64
Generate ellipse and landscape plots of Gaussian mixture.
verifications, 1D and 2D plots of GM. For 2D, it can be controlled to plot ellipses and/or landscapes of GM. It has detail descrptions of the inputs.Please contact me if you find any bug.
HRViewer is a matlab software tool designed for in deep viewing and comparing HRV indices computed from different EKG files as well as diffe
loosely couple position updates into error state Kalman filter
tightly couple imu with range and range rate updates
generate imu trail and propagate error state Kalman filter
Create a colored, tilted 2D error ellipse scatter plot.
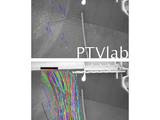
A GUI based tool to preprocess, analyze, validate, postprocess, visualize and simulate PTV data.
%generates and plots (x,y) coordinates for ellipse
%INPUT: %theta=tilt angle in radians %n = number of points to draw the ellipse%OUTPUT: %xt = acos(t)cos(theta)-bsin(t)sin(theta) %yt = bsin(t)cos(theta)+acos(t)sin(theta)

Aggregate packing generator with fibers used for the simulation of aggregate and fibers in composites
Ellipsoids=Particles_Distribution(Classes,x,y,z,er)Generates aggregate with ellipsoids shapes4-function Plot_Ellipsoids(Ellipsoids,x,y,z)Plots ellipsoids5-function Ellipses=Ellipsoids_to_Ellipses(Ellipsoids,dist,r_min)Converts ellipsoids to ellipses. used for
Function to plot an ellipse given center, semi-major and semi-minor radius and angle of tilt (rotation) with respect to the x-axis
Function to plot an ellipse given center, semi-major and semi-minor radius and angle of tilt (rotation) with respect to the x-axis
2D kernel density estimator from weighted data.
A very fast multivariate bandwidth calculation for KDE that can even be calculated from a GMM.

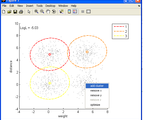
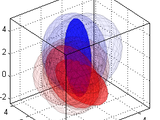
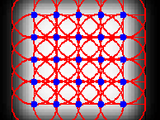
Visualise a 2x2 covariance matrix by plotting ellipses at 1, 2 and 3 standard deviations.
Assuming `size(X,2) == 2` then```plotcov(cov(X), mean(X));```will draw ellipses at 1, 2 and 3 standard deviations.See also (or just run) `plotcov_demo` for an example.
Framework to design algorithms of indoor positioning. Simulation of access points signals and inertial signals.
You can also select a web site from the following list
Americas
- América Latina (Español)
- Canada (English)
- United States (English)
Europe
- Belgium (English)
- Denmark (English)
- Deutschland (Deutsch)
- España (Español)
- Finland (English)
- France (Français)
- Ireland (English)
- Italia (Italiano)
- Luxembourg (English)
- Netherlands (English)
- Norway (English)
- Österreich (Deutsch)
- Portugal (English)
- Sweden (English)
- Switzerland
- United Kingdom (English)
Asia Pacific
- Australia (English)
- India (English)
- New Zealand (English)
- 中国
- 日本Japanese (日本語)
- 한국Korean (한국어)