
Quantile regression
Quantile regression with LP or interior method.It has kernel test and wald test.See example in readme.m
- 1K (All time)
- 2 (Last 30 days)
- 5.0 / 5
- Community
-
20 Jul 2022
Bivariate kernel density and regression
Bivariate kernel density, kernel regression, and kernel quantile regression
Returns, for two data series:Marginal kernel densitiesBivariate kernel densityConditional kernel densityNadaraya-Watson kernel regressionkernel quantile regressionMethod: Gaussian kernel, Silverman
- 377 (All time)
- 1 (Last 30 days)
- 5.0 / 5
- Community
-
13 Sep 2013

- 2.3K (All time)
- 1 (Last 30 days)
- 5.0 / 5
- Community
-
16 Jul 2024

Non-crossing polynomial quantile regression
Non-crossing polynomial quantile regression
ncquantreg finds the coefficients of a polynomial p(x) of degree n that fits the data in vector x to the quantiles tau of y.ncquantreg(x,y) performs median regression (tau = 0.5) using a polynomial
- 307 (All time)
- 2 (Last 30 days)
- -- / 5
- Community
-
17 Jan 2016

Quantile regression with bootstrapping confidence intervals
Quantile Regression USAGE: [p,stats]=quantreg(x,y,tau[,order,nboot]); INPUTS: x,y: data that is fitted. (x and y should be columns) Note: that if x is a matrix with several columns
- 6.4K (All time)
- 4 (Last 30 days)
- 3.9 / 5
- Community
-
16 Mar 2015

Variational Bayesian Monte Carlo (VBMC): Bayesian inference
Variational Bayesian Monte Carlo (VBMC) algorithm for Bayesian posterior and model inference in MATLAB
- 541 (All time)
- 2 (Last 30 days)
- 5.0 / 5
- Community
-
26 Oct 2022
MATLAB for R Users in Computational Finance
Learn how to use MATLAB and R together to tackle your computational needs
- 2.8K (All time)
- 1 (Last 30 days)
- -- / 5
- Community
-
1 Sep 2016

Quantile-quantile plot with patch option
NOTE: this function is now available from the IoSR Matlab Toolbox as iosr.statistics.qqPlot. ------------------------- qq_plot(y) displays a quantile-quantile plot of the sample quantiles of y versus
- 900 (All time)
- 2 (Last 30 days)
- 5.0 / 5
- Community
-
11 Aug 2016

Quantile Probability Plot
This code generates Quantile Probability Plots, often used in investigating the distribution of reaction times when there are several conditions and several subjects. With this code you can easily
- 294 (All time)
- 1 (Last 30 days)
- 5.0 / 5
- Community
-
20 Feb 2015

Multivariate Polynomial Regression
Performs polynomial regression on multidimensional data.
Performs Multivariate Polynomial Regression on multidimensional data. The fits are limited to standard polynomial bases with minor modification options. Feel free to implement a term reduction
- 9K (All time)
- 9 (Last 30 days)
- 5.0 / 5
- Community
-
3 Dec 2020
Calculate the quantiles of a vector or matrix data using linear interpolation.
Example using matrix X = [1 2; 2 5; 3 6; 4 10; 7 11; 10 13];p = [0.25 0.50 0.75];Q = quantile(X,p)Q = 2.2500 5.25003.5000 8.00006.2500 10.7500See more examples described in the script files.
- 356 (All time)
- 3 (Last 30 days)
- 5.0 / 5
- Community
-
28 Oct 2020
Quantiles of a sample via various methods
NOTE: this function is now available from the IoSR Matlab Toolbox as iosr.statistics.quantile. ------------------------- This function calculates quantiles and weighted quantiles for vectors
- 1.6K (All time)
- 1 (Last 30 days)
- 4.7 / 5
- Community
-
11 Aug 2016

Normal Quantile with Precision
computes the normal quantile function with high precision for extreme values in the tail
computes the quantile function of the standard normal distribution, truncated to the interval [l,u].Method designed for precision in the tails. Inf values for vectors 'l' and 'u' accepted;%Example
- 269 (All time)
- 1 (Last 30 days)
- 5.0 / 5
- Community
-
27 Apr 2016
This is an implementation of Sim, N., & Zhou, H. (2015). Oil prices, US stock return, and the dependence between their quantiles. Journal of
# Quantile-on-Quantile Regression (QQR) Toolbox for MATLABA MATLAB implementation of the Quantile-on-Quantile Regression method for analyzing dependence structures across conditional distributions
- 2 (All time)
- 2 (Last 30 days)
- -- / 5
- Community
-
23 Mar 2026
Inference on quantiles: confidence intervals, p-values, and testing
Improved quantile inference for one- and two-sample (e.g., treatment vs. control) cases
Detailed documentation includes further explanation and examples; just type "help quantile_inf". The following briefly describes functionality as well as the theoretical foundations from the
- 828 (All time)
- 1 (Last 30 days)
- 5.0 / 5
- Community
-
23 Mar 2012
- 2K (All time)
- 2 (Last 30 days)
- 5.0 / 5
- Community
-
11 Aug 2016

ISO 226:2003 Normal equal-loudness-level contours
Return sound pressure levels of pure tone frequencies at specified loudness level(s).
- 1.2K (All time)
- 2 (Last 30 days)
- 5.0 / 5
- Community
-
11 Aug 2016

- 3K (All time)
- 3 (Last 30 days)
- 5.0 / 5
- Community
-
11 Aug 2016
Impulse response acoustic information calculator
Calculate RT, DRR, Cte, and EDT for impulse response file
- 4.4K (All time)
- 1 (Last 30 days)
- 5.0 / 5
- Community
-
11 Aug 2016

Nonlinear Regression using ANFIS in MATLAB
Application of ANFIS to multi-variable nonlinear regression, function approximation and modleing
For more information, see following links:http://yarpiz.com/301/ypfz101-nonlinear-regression-using-anfis
- 2.2K (All time)
- 6 (Last 30 days)
- 5.0 / 5
- Community
-
11 Sep 2015
Fit data using orthogonal linear regression.
each datapoint DATA(i,:) -- LINORTFITN finds N and C such that the sum of squared distances is minimized.There is already a file in Matlab Central for orthogonal linear regression in 2 dimensions, but it
- 4.4K (All time)
- 3 (Last 30 days)
- 4.7 / 5
- Community
-
10 Oct 2007
A variety of regression utilities
This zip file contains 11 functions related to regression. The functions are:1) cookdist.m - Cook's distance for data points2) dregr.m - Deming regression3) irsvdregr.m - Iterative Reweighted Least
- 1.5K (All time)
- 1 (Last 30 days)
- 5.0 / 5
- Community
-
15 Nov 2020

Draw a box plot with various display options
Automated construction of a legend. - Set box limits as percentiles. - Set whisker extent via various methods.- Use of weighted quantiles.- Creation of violin plots.
- 10.9K (All time)
- 6 (Last 30 days)
- 4.7 / 5
- Community
-
28 Jun 2017
Estimates a Student's t regression model
Estimates a Student's t regression model:y = X*beta + epswhere eps ~ Student's t (0, sigma, nu).with nu > 2.Parameters are estimated with maximum likelihood.
- 915 (All time)
- 1 (Last 30 days)
- 5.0 / 5
- Community
-
16 Aug 2009

A non-parametrical regression (smoothing) tool using Gaussian kernel.
Non-parametric regression is widely used in many scientific and engineering areas, such as image processing and pattern recognition.Non-parametric regression is about to estimate the conditional
- 19K (All time)
- 3 (Last 30 days)
- 4.5 / 5
- Community
-
24 Dec 2008
Boosted Binary Regression Trees
Boosted Binary Regression Trees is a powerful regression method which can handle vector targets.
Boosted Binary Regression Trees (BBRT) is a powerful regression method proposed in [1]. BBRT combines binary regression trees [3] using a gradient boosting technique.There are several variants
- 2.6K (All time)
- 1 (Last 30 days)
- 5.0 / 5
- Community
-
12 Jul 2016

Gaussian Process regression
Gaussian Process regression based on posterior updates of noise-less observations
- 809 (All time)
- 2 (Last 30 days)
- 5.0 / 5
- Community
-
11 May 2017

Five parameters logistic regression - There and back again
Fit data points with a five points logistic regression or interpolate data.
Five parameters logistic regressionOne big holes into MatLab cftool function is the absence of Logistic Functions. In particular, The Five Parameters Logistic Regression or 5PL nonlinear regression
- 1.9K (All time)
- 2 (Last 30 days)
- 5.0 / 5
- Community
-
3 Dec 2025

- 2.8K (All time)
- 3 (Last 30 days)
- 4.4 / 5
- Community
-
15 Mar 2023

plot quantiles of y given quantiles of x.
inter-quartile range. X and Y must have the same number of rows or columns.This is useful to visualize two-dimensional distributions.Options include e.g.: plotting different quantiles; means/variances instead of
- 2.3K (All time)
- 2 (Last 30 days)
- 5.0 / 5
- Community
-
12 Jan 2010

Removes outliers from X and Y variables based on regression residuals
This function accepts two (vector of) variables for which a bivariate linear regression analysis is meant to be performed, and removes the outliers from both variables. Since the regression residual
- 975 (All time)
- 2 (Last 30 days)
- 5.0 / 5
- Community
-
18 Jun 2012

Four parameters logistic regression - There and back again
Fit data points with a four points logistic regression or interpolate data.
Four parameters logistic regression.One big holes into MatLab cftool function is the absence of Logistic Functions. In particular, The Four Parameters Logistic Regression or 4PL nonlinear regression
- 3.2K (All time)
- 5 (Last 30 days)
- 4.8 / 5
- Community
-
20 Nov 2025

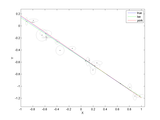
Linear Regression plot with Confidence Intervals in MATLAB
Sample code to plot linear regression curve with confidence intervals.
This is a simplified code to generate a linear regression curve for your paper/report/assignment. Just replace the sample data and comment the line 17 : axis([0.04 0.3 0.03 .35]);This code is
- 1.7K (All time)
- 2 (Last 30 days)
- 4.6 / 5
- Community
-
16 Aug 2020
Linear Regression with Errors in X and Y
Calculates slope and intercept for linear regression of data with errors in X and Y.
Calculates slope and intercept for linear regression of data with errors in X and Y. The errors can be specified as varying point to point, as can the correlation of the errors in X and Y.The
- 7.6K (All time)
- 3 (Last 30 days)
- 5.0 / 5
- Community
-
3 Feb 2010

Passing & Bablok regression is a linear regression procedure usefull for comparing clinical methods
. Classical linear regression method assume that variables X and Y are normal distributed and with a measurement error costant over the range of concentrations.However, in method comparison studies we generally
- 2.4K (All time)
- 3 (Last 30 days)
- 5.0 / 5
- Community
-
16 Jan 2010

Probabilistic Linear Regression
Probabilistic Linear Regression with automatic model selection
This package contains functions that fit a probabilistic linear regression model. For the ordinary regularized linear regression, user has to manually assign the regularization parameter. However
- 638 (All time)
- 2 (Last 30 days)
- 5.0 / 5
- Community
-
13 Mar 2016
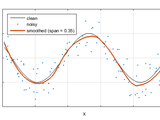
LOESS performs a locally weighted regression fit to noisy data
Function fLOESS performs LOESS (locally weighted non-parametric regression fitting using a 2nd order polynomial) smoothing to one dimensional data, without the Matlab Curve Fitting Toolbox. This
- 2.4K (All time)
- 5 (Last 30 days)
- 4.9 / 5
- Community
-
10 Mar 2016

- 2.2K (All time)
- 8 (Last 30 days)
- 4.8 / 5
- Community
-
5 Sep 2019

- 1.1K (All time)
- 3 (Last 30 days)
- 4.3 / 5
- Community
-
11 Aug 2016
This is ridge regression implemented using the Gaussian Kernel.
The Gaussian Kernel can be changed to any desired kernel. However such a change will not dramatically improve results. This is a variant of ridge regression using the kernel trick (Mercers Theorem).
- 2.4K (All time)
- 1 (Last 30 days)
- 5.0 / 5
- Community
-
14 Apr 2010
Interactive regression on a plot
Perform regression on plotted data in a figure by manually choosing the regression area.
Plot data in a figure, and then interactively choose regression area. The result from polyfit is returned.Example:x=1:1:10;y=sin(x);f=figure; plot( x,y );[p,h] = figreg( f, 2 );%fit a second order
- 520 (All time)
- 1 (Last 30 days)
- 5.0 / 5
- Community
-
25 Aug 2010
This is a set of MATLAB functions to do Bayesian linear regression
This is a set of MATLAB functions to do Bayesian linear regression. Derivations are also included.
- 3.3K (All time)
- 2 (Last 30 days)
- 5.0 / 5
- Community
-
20 Nov 2014

Support Vector Regression (SVR)
Support Vector Regression (SVR)
Support Vector Regression (SVR)Support Vector Regression (SVR) is a type of regression analysis that uses Support Vector Machines (SVMs) to perform linear or nonlinear regression. Similar to SVMs for
- 447 (All time)
- 4 (Last 30 days)
- 5.0 / 5
- Community
-
24 Oct 2023

Local Regression for 2D Data with plot/figure
This function will perform a local regression at the given points. Using the data at hand. You will need to input a spanwidth which will tell the function how many datapoints he will use in the local
- 919 (All time)
- 1 (Last 30 days)
- 5.0 / 5
- Community
-
26 Aug 2010
- 810 (All time)
- 4 (Last 30 days)
- 5.0 / 5
- Community
-
13 Sep 2022

Regression with Gradient Descent
Regression with Gradient Descent; A coefficient finding technique for the desired system model.
Regression with Gradient Descent; A coefficient finding technique for the desired system modelI included different functions to model the data using descent gradient techniqueperformed Linear
- 1.7K (All time)
- 1 (Last 30 days)
- 5.0 / 5
- Community
-
15 Oct 2018

Local Linear Kernel Regression
A function to provide local linear estimator of Gaussian kernel regression
This is the local linear version of the kernel smoothing regression function: http://www.mathworks.com/matlabcentral/fileexchange/loadFile.do?objectId=19195&objectType=FILEThe local linear
- 8.6K (All time)
- 1 (Last 30 days)
- 4.5 / 5
- Community
-
14 Apr 2008

Curve fitting, empirical modeling, and an appreciation of shape
The art of fitting a nonlinear regression model often starts with choosing a model form. This submission is an attempt to teach the reader a simple but general paradigm for their models as a sum of
- 6.3K (All time)
- 3 (Last 30 days)
- 5.0 / 5
- Community
-
22 Jun 2006
MATDRAM: Delayed-Rejection Adaptive Metropolis MCMC
MatDRAM is a pure-MATLAB Adaptive Markov Chain Monte Carlo simulation and visualization library.
, sampling, and integration of mathematical objective functions of arbitrary-dimensions, in particular, the posterior probability distributions of Bayesian regression models in data science, Machine Learning
- 557 (All time)
- 3 (Last 30 days)
- 5.0 / 5
- Community
-
16 Jul 2024
- 1.1K (All time)
- 7 (Last 30 days)
- 4.5 / 5
- Community
-
14 Aug 2023
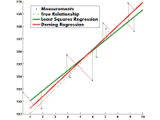
deming perfoms a linear Deming regression. Useful when errors are present in both x and y variables.
[ b sigma2_x x_est y_est stats] = deming(x,y,lambda,alpha)deming() performs a linear Deming regression to find the linear coefficients: y = b(1) + b(2)*xunder the assumptions
- 2.1K (All time)
- 4 (Last 30 days)
- 4.0 / 5
- Community
-
29 Sep 2014

Binary Classification is done by making a Decision Boundary through logistic regression approach
Logistic regression is a classification approach for different classes of data in order to predict whether a data point belongs to one class or another. Sigmoid hypothesis function is used to
- 2.5K (All time)
- 2 (Last 30 days)
- 5.0 / 5
- Community
-
22 Feb 2018
Multiscale Geographically Weighted Regression
multiscale geographically weighted regression
This code implement multiscale geographically weighted regression, it can predict at unsampled locations. Two test codes show how to use them.
- 50 (All time)
- 1 (Last 30 days)
- 5.0 / 5
- Community
-
9 Jun 2025

Gaussian Mixture Model (GMM) - Gaussian Mixture Regression (GMR)
Encoding of data in Gaussian Mixture Model and retrieval through Gaussian Mixture Regression
GMM-GMR is a set of Matlab functions to train a Gaussian Mixture Model (GMM) and retrieve generalized data through Gaussian Mixture Regression (GMR). It allows to encode efficiently any dataset in
- 19.3K (All time)
- 1 (Last 30 days)
- 4.8 / 5
- Community
-
24 Jul 2009
- 806 (All time)
- 1 (Last 30 days)
- 5.0 / 5
- Community
-
11 Aug 2016
Calculate subplot positions by specifying figure margins and axis scaling.
- 985 (All time)
- 1 (Last 30 days)
- 5.0 / 5
- Community
-
11 Aug 2016
Geometric Mean Regression (Reduced Major Axis Regression).
Model II regression should be used when the two variables in the regression equation are random and subject to error, i.e. not controlled by the researcher. Model I regression using ordinary least
- 2.2K (All time)
- 5 (Last 30 days)
- 5.0 / 5
- Community
-
2 Apr 2014
- 2.5K (All time)
- 2 (Last 30 days)
- 4.0 / 5
- Community
-
11 Aug 2016
Fast Ridge regression with multiple ridge parameters and response variables.
ridge_fast is a high-performance MATLAB function designed to perform ridge regression with multiple response variables and multiple ridge penalty values—significantly faster than MATLAB’s built-in
- 28 (All time)
- 2 (Last 30 days)
- 5.0 / 5
- Community
-
10 Feb 2025
Generates fuzzy inference system (FIS) using regression tree algorithm and ANFIS training
The archive includes genfis4.m that generates Mamdani- and Sugeno-type FIS using regression tree algorithm to extract fuzzy rule information from data set. It is based mostly on Fuzzy Logic Toolbox
- 4.6K (All time)
- 2 (Last 30 days)
- 5.0 / 5
- Community
-
25 Feb 2017