Get Started with Lidar Camera Calibrator
The Lidar Camera Calibrator app enables you to interactively perform extrinsic calibration between a lidar sensor and a camera by estimating the rigid transformation between them. The app supports checkerboard targets for performing extrinsic calibration.
This topic shows you the Lidar Camera Calibrator app workflow, as well as features you can use to analyze and improve your results. The first and the most important part of the calibration process is to obtain accurate and useful data. For guidelines and tips for capturing data, see Calibration Guidelines.
Prerequisites
Before using the Lidar Camera Calibrator app, you must meet these prerequisites:
You must have at least four pairs of image and point cloud files. For best calibration results, collect 10–20 data pairs.
The app supports point cloud data in the PLY and PCD formats, and images in the PNG, JPG, JPEG, TIF, and TIFF file formats. You must import raw images into the app. The app undistorts the input images using the camera intrinsic parameters and displays the undistorted images.
If your data is stored in a rosbag file, see the Read Lidar and Camera Data from Rosbag File example for information on how to convert it to a supported format.
The data from the camera and lidar sensors must be time-synchronized.
Because the app sorts image and point cloud files by filename and pairs them from the sorted lists, to ensure accurate pairings, you must name these files consistently, such as
'img_001'and'pc_001'.When you collect data, the checkerboard must point towards the front axes of the camera (z-axis) and lidar sensor (x-axis). For more information on data collection guidelines, see Calibration Guidelines.
To avoid inaccurate checkerboard detection in images, use asymmetric checkerboard patterns, with an odd number of squares in one dimension and an even number of squares in the other dimension.
Open Lidar Camera Calibrator App
To open the Lidar Camera Calibrator app, enter this command in the MATLAB® command prompt.
lidarCameraCalibrator
The app opens to an empty session. Alternatively, you can open the app from the Apps tab, under Image Processing and Computer Vision.
Load Data
The app enables you to load image and point cloud data. You can also specify checkerboard parameters and camera intrinsics for checkerboard corner detection.
To load the calibration data into the app, follow these steps:
On the app toolstrip, select Import. This opens the Import Data dialog box.
In the Folder for images field, specify the path to the folder that contains the PNG, JPG, JPEG, TIF, or TIFF image files you want to load. Alternatively, click the folder icon next to the field and navigate to the folder containing the images, then click Select Folder. For example, navigate to this image data, where
matlabrootis your MATLAB root folder:matlabroot\toolbox\lidar\lidardata\calibration\images
Note
You must import raw images into the app. The app undistorts the input images using the camera intrinsic parameters and displays the undistorted images.
In the Folder for point clouds field, specify the path to the folder that contains the sequence of PCD or PLY files you want to load. Alternatively, click the folder icon next to the field and navigate to the folder containing the files, then click Select Folder. For example, navigate to this point cloud data, where
matlabrootis your MATLAB root folder:matlabroot\toolbox\lidar\lidardata\calibration\pointClouds
To view the list of matched pairs, click View Matched Pairs. In the View Matched Pairs dialog box, select or clear the pairs which you want to import. Ensure that the mapping of the data pairs is accurate, and then click Accept.
In the Checkerboard Settings section, specify these checkerboard detection parameters:
Units — Select the units of measurement from these options:
millimeters,centimeters,meters, orinches.Square Size — Specify the size of each checkerboard square as a positive scalar. For example, specify
100mmas the square size for the data loaded from thecalibrationfolder.Padding — Specify the padding values for the checkerboard as a four-element row vector of nonnegative integers. For example, specify
[100 100 100
                                        100]
mm padding for the data you loaded from thecalibrationfolder in the previous step. For more information on padding, see Checkerboard Guidelines.
In the Camera Intrinsics section, specify camera intrinsic parameters that correspond to the data. For this example, the intrinsic parameters are saved in a MAT file.
Select
Load from Fileand then load this file:matlabroot\toolbox\lidar\lidardata\calibration\images\intrinsics.mat
The options to specify camera intrinsic parameters are:
Load from Workspace— Load camera intrinsic parameters from a valid variable in the MATLAB workspace. The app supports loading camera intrinsic parameters from thecameraIntrinsicsandcameraParametersobjects.Load from File— Load camera intrinsic parameters from a valid MAT file that stores data using thecameraIntrinsicsorcameraParametersobject.Compute Intrinsics— Select this option when you want the app to automatically compute camera intrinsic parameters from the input image data. Note that this app does not support fine-tuning and validation of camera intrinsic parameters and you must use images captured for single camera calibration to obtain accurate intrinsics. For best camera calibration results, use the Camera Calibrator app to compute the intrinsics. For information on how to collect data for camera calibration, see Prepare Camera and Capture Images for Camera Calibration.
Click OK to import your data.
Tip
To import more images and point clouds at any point in the session, select Import.
Detect Checkerboards in Images
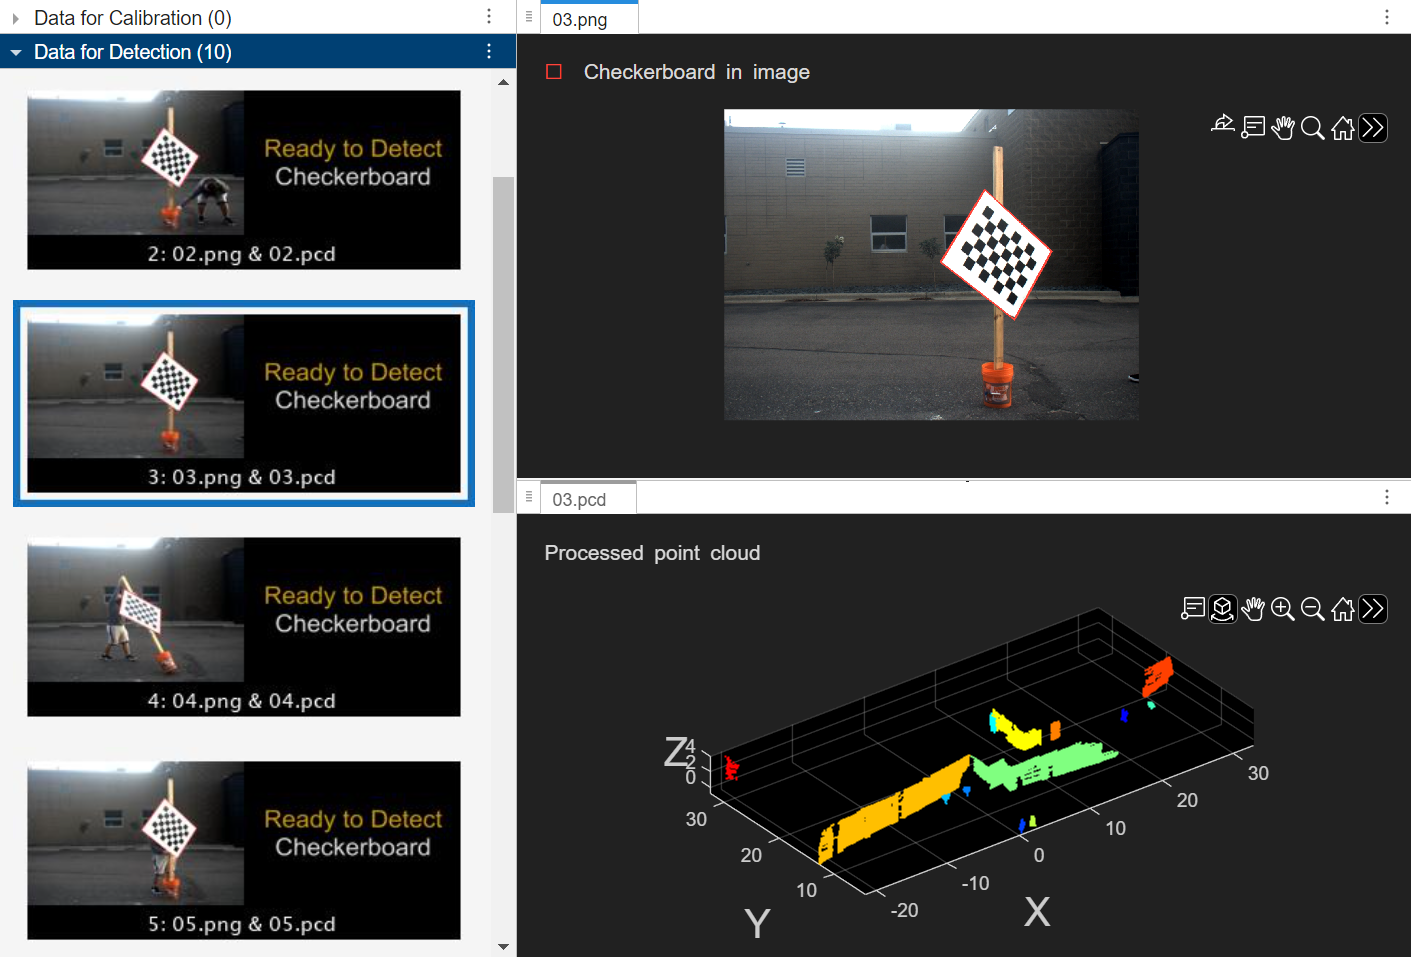
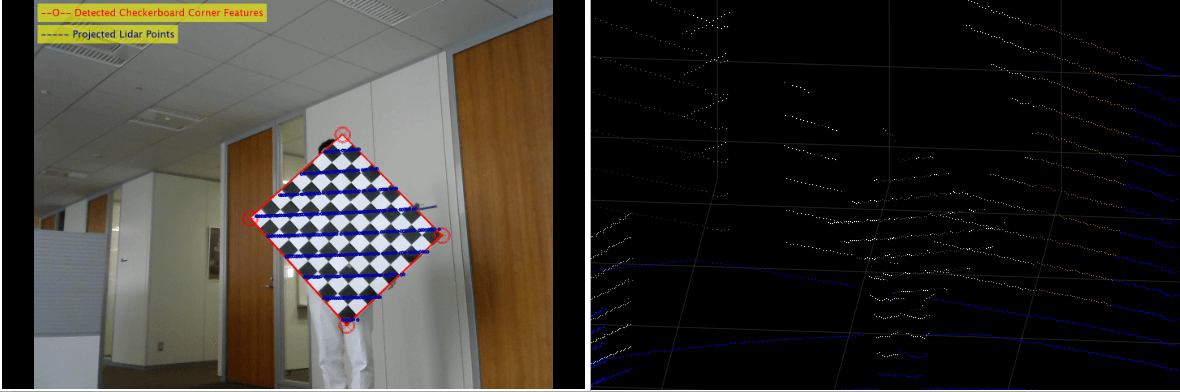
After you load the data, the app processes the images to automatically detect checkerboard corners in them. The app imports only those data pairs that have a valid checkerboard detection in the image. The app displays the imported data pairs in the Data for Detection pane. The checkerboard borders in the image are marked in red. You can select a pair in the Data for Detection pane to display it in the visualization pane.
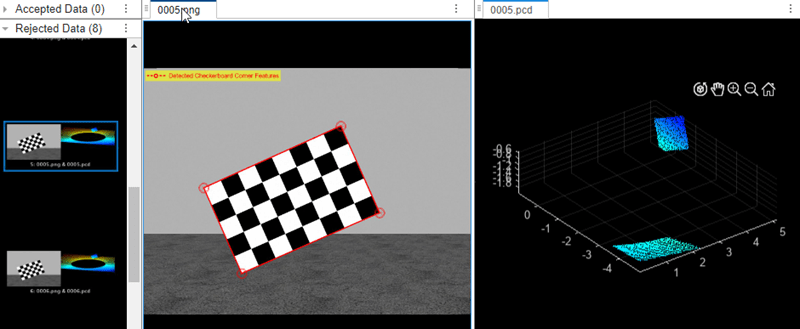
Tip
The default app layout arranges the selected data pair in a left-to-right configuration in the visualization pane. To arrange the selected data pair in a top-down layout, as shown in this image, click the three-dot menu at the top-right corner of the image or point cloud plot. Then select Tile All > Top/down.
Change Camera Intrinsic Parameters
To modify the camera intrinsic parameters after importing data, click Import > Update Camera Intrinsics. In the Update Camera Intrinsics dialog box that opens, you can import
a cameraIntrinsics or cameraParameters object from the workspace. Alternatively, you can
load a MAT file that stores data as a cameraInstrinsics or
cameraParameters object.

Process Point Cloud
To prepare the point cloud data for detecting checkerboard corners, tune the processing parameters from the Process Point Cloud section of the app toolstrip. The app applies these processing steps before checkerboard detection.
Region of Interest (ROI) Selection — By default, the app uses the entire point cloud for checkerboard detection. To manually select an ROI, select Edit ROI on the app toolstrip. For more information, see Select Region of Interest.
Ground Removal — To remove the ground from the point cloud, select Remove Ground on the app toolstrip. The app uses the simple morphological filter (SMRF) algorithm with these parameters, which work for typical calibration data:
MaxWindowRadius=8ElevationThreshold=0.2ElevationScale=1.25
For more information on the SMRF algorithm, see Simple Morphological Filter.
Downsampling — Downsample a point cloud to speed up checkerboard detection. The app toolstrip includes the Downsample Grid Size parameter, which specifies the size of the 3-D box in which to apply a voxel grid filter for downsampling a point cloud. Increase the value of this parameter to speed up checkerboard detection. To skip the downsampling step, set this parameter to
0.Clustering — The app runs a clustering algorithm, which is based on the Euclidean distance between two adjacent points. If the distance is less than the Cluster Threshold parameter, in meters, both adjacent points belong to the same cluster. Low-resolution lidar sensors require a higher Cluster Threshold, while high-resolution lidar sensors benefit from a lower Cluster Threshold.
To visualize the effects of the processing parameters, select Preview Processed Data. Ensure that the ROI contains the entire checkerboard. If a part of the checkerboard is missing from the processed point cloud, try clearing Remove Ground. However, if you still need to remove the ground to improve clustering, try specifying the ROI such that it excludes the ground.
You must also ensure that the checkerboard corresponds to a cluster with minimal points from other objects, such as tripods. The app visualizes each cluster using a different color. If the checkerboard is in the same cluster as a different object, try decreasing the cluster threshold. If the checkerboard is part of more than one cluster, try increasing the cluster threshold.
Select Region of Interest
Specifying a region of interest in which to detect the checkerboard can improve the detection speed. It can also improve detection results by removing objects that might cause false detections due to their resemblance to the shape and size of a checkerboard. To specify a region of interest, first, from the app toolstrip, select Edit ROI. This opens the Edit ROI tab.
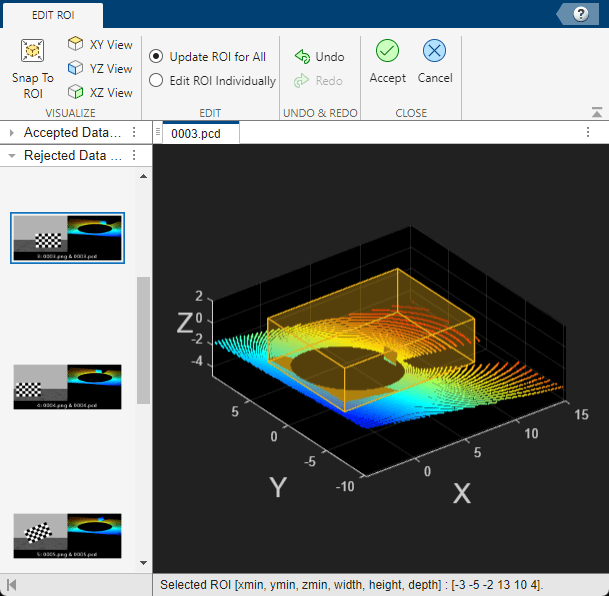
In the Edit ROI tab, the app displays point cloud data with an ROI cuboid. Adjust the ROI cuboid to more closely match the region containing the checkerboard.
Use these steps to select the ROI.
Select any data pair from the Data for Detection pane.
To adjust the ROI in the point cloud pane, on the Edit ROI tab, hover over the ROI cuboid. The pointer changes to a hand symbol. Click a side of the ROI, and drag to adjust the cuboid size. Ensure the ROI cuboid fully encloses the checkerboard.
Note
To adjust the ROI cuboid, you must clear all axes interactions (pan, zoom-in, zoom-out, rotate 3D) from the toolbar at the top-right corner of the axes.
To lock the cuboid dimensions, right-click the cuboid and select Lock Dimensions. Once you lock the cuboid dimensions, you can drag the cuboid to modify your selection. You can also undo and redo your modifications to the ROI from using the Undo and Redo buttons in the toolstrip.
Select Snap To ROI to visualize the checkerboard points within the ROI cuboid. To view the whole point cloud and adjust the cuboid selection, clear Snap To ROI.
You can also use the XY View, YZ View, and XZ View options to visualize the top view, front view, and side view of a point cloud scene, respectively.
Select Accept to save your changes, or Cancel to discard them.
After updating the ROI, you can visualize the effects of the processing steps with the new ROI. To do so,select Preview Processed Data. If Preview Processed Data has already been selected, the processed point cloud updates automatically when you save the new ROI.
Tip
You can use keyboard shortcuts to perform these tasks. For Edit ROI keyboard shortcuts, see Edit ROI.
Detect Checkerboards in Point Clouds
After processing the point clouds, you can detect checkerboards automatically using the selected processing parameters. Alternatively, you can manually select the checkerboards.
Detect Checkerboards Automatically
To detect checkerboards automatically from point cloud data:
Set parameters:
Tolerance — Specifies the uncertainty allowed in the rectangular plane dimensions. The range must be within [0, 1], and the default is
0.05. The value defines the permissible deviation from the expected board size. For example, the valid range is [width − width*Tolerance, width + width*Tolerance]. A higher tolerance accepts more variability in the detected board size.Plane Fit Distance — Maximum distance used to fit a plane to each cluster during board detection. For noisy data, decrease this value to remove outliers and obtain more detections. For this dataset, set it to
0.05.
Run detection: Click Detect Checkerboard. The app applies your parameters, moves detected checkerboards from Data for Detection to Data for Calibration, and highlights detected borders in yellow. The toolstrip lists the parameters used for each selected point cloud.
Verify Results: Visually inspect the checkerboard borders in Data for Calibration. If the borders are inaccurate, right-click the data pair and select Reject Detection. The app moves the data pair back to Data for Detection. To remove a data pair from the session entirely, right-click it and select Remove.
If detection fails: If the app cannot detect a checkerboard, the data pair remains in Data for Detection and its status changes from
Ready to Detect CheckerboardtoCheckerboard Not Detected. To improve results, tune the Process Point Cloud parameters or slightly increase Tolerance, then rerun detection. If automatic detection still fails, use manual selection.
Select Checkerboards Manually
If automatic checkerboard detection does not give the desired results, you can manually select a checkerboard by marking four non-collinear points on the checkerboard. For manual selection, do not set the Tolerance parameter; the app adjusts it automatically.
Open manual selection: Click Select Checkerboard in the Detect Checkerboard in Point Cloud section of the toolstrip. The Select Checkerboard tab opens, where you can select checkerboard points for data pairs in the Data for Detection pane.
Choose a data pair: Select a data pair from the Data for Detection pane.
Locate the checkerboard: Use the zoom and rotate tools in the axes toolbar to view the checkerboard. You can also switch to XY View, YZ View, or XZ View for top, front, or side views. If you defined an ROI, click Snap To ROI in the Visualize section to display points inside the ROI
Add points: In the Draw section, click Add Points and mark four non-collinear points on the checkerboard plane. The selected points appear in red. Press Esc to stop adding points. To reset, click Clear Selection.
Check the selection: Rotate the point cloud to confirm that your point selection resulted in a red highlighted area that encloses the checkerboard and does not include background points. To adjust, click Edit Selection in the Edit section, reposition the corners, and then click Save or Discard.
Repeat for other pairs: Perform steps 2–5 for each remaining data pair.
Save or cancel: To apply the selections across all data pairs, click Accept in the Close section. To discard them, click Cancel.
Calibration
When you are satisfied with the detection results, click Calibrate to
calibrate the sensors. If you have an estimated transformation matrix, select
Load Initial Transformation to load the transformation
matrix, specified as a rigidtform3d object, from a file or the
workspace. The app assumes the rotation angle between the lidar sensor and the camera is
in the range [–45, 45], in degrees, along each axis. For a rotation angle outside this
range, load an initial transformation to improve calibration accuracy.
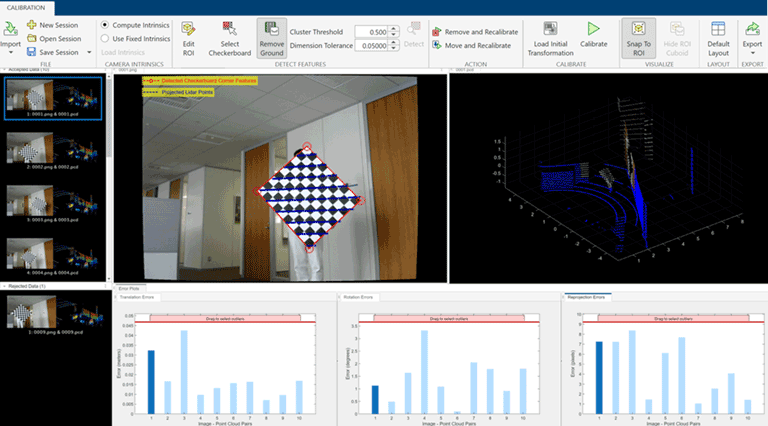
After calibration, the app displays the image and point cloud, each displaying its own
checkerboard detection overlaid with the checkerboard projected from the other source.
The app also fuses color information from the images with the point cloud data using the
fuseCameraToLidar function.
The app also provides the error metrics for the resulting transformation using error plots. The plots specify these errors in each data pair.
Translation Errors — The difference between the centroid coordinates of the checkerboard planes in the point clouds and those in the corresponding images. Units are in meters.
Rotation Errors — The angle between the normal vectors of the detected checkerboard planes in the point clouds (lidar frame) and those in the images (camera frame). The app estimates the plane in the image using the checkerboard corner coordinates. Units are in degrees.
Reprojection Error— The difference between the projected (transformed) centroid coordinates of the checkerboard planes from the point clouds and those in the corresponding images. Units are in pixels.
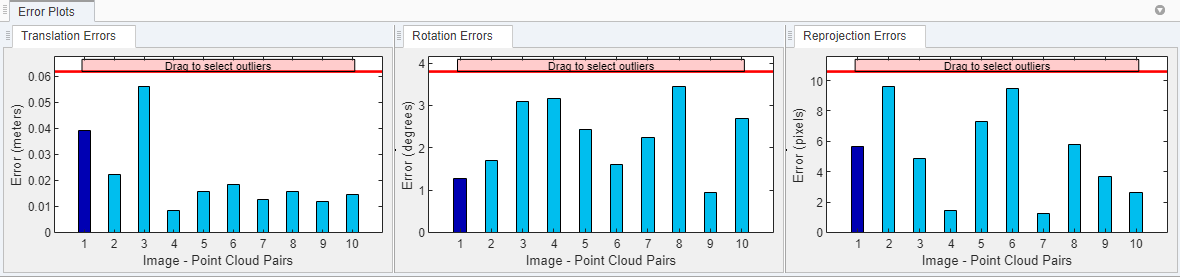
When you select a data pair in the Data for Calibration pane, the corresponding bars in the error plots are highlighted in dark blue. You can tune the calibration results by removing outliers. Drag the red line on each plot vertically to set error limits. The app defines all the data pairs with an error value greater than error limit as outliers, and highlights their error bars and corresponding data pairs in the Data for Calibration pane in blue. Right-click any of the selected data pairs in the Data for Calibration pane and select one of these options:
Exclude in Next Calibration — The app retains the selected data pairs in the Data for Calibration pane, but excludes them from the next calibration. To indicate exclusion from calibration, the selected data pairs and their corresponding bars in the error plots turn gray.
To reuse an excluded data pair in the next calibration, right-click that data pair in the Data for Calibration pane, and select Use in Next Calibration. The app highlights the data pair and corresponding bars in the error plots in blue.
Reject Detection and Recalibrate — The app moves the selected data pairs from the Data for Calibration pane to the Data for Detection pane, and recalibrates the sensors with the remaining data pairs in the Data for Calibration pane.
Remove and Recalibrate— The app removes the selected data pairs from the current calibration session, and recalibrates with the remaining data pairs in the Data for Calibration pane.
For a list of keyboard shortcuts to use with the error plots, see Error Plots.
Export Results
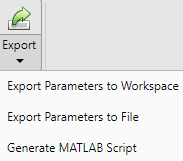
You can export the transformation matrix and error metrics, as variables, into the workspace or a MAT file. You can also generate a MATLAB script of the complete app procedure to use in your projects.
Keyboard Shortcuts and Mouse Actions
Note
On Macintosh platforms, use the Command (⌘) key instead of Ctrl.
Use keyboard shortcuts and mouse actions to increase productivity while using the Lidar Camera Calibrator app.
Data Browser
| Task | Action |
|---|---|
| Navigate through data pairs in the Data for Detection or Data for Calibration pane. | Up or down arrow |
| Select all data pairs in the Data for Detection or Data for Calibration pane. | Ctrl+A |
| Select multiple data pairs above or below the currently selected data pair. | Hold Shift and press the up arrow or down arrow |
Select multiple data pairs. | Hold Ctrl and click the desired data pairs |
| Delete the selected data pair from the data browser. |
A dialog box appears to confirm deletion. |
| Select the data pair N above the currently selected data pair. N is the number of data pairs fully displayed in the data browser at the current time. |
|
| Select the data pair N below the currently selected data pair. N is the number of data pairs fully displayed in the data browser at the current time. |
|
| Select the first data pair in the Data for Detection or Data for Calibration pane. |
|
| Select the final data pair in the Data for Detection or Data for Calibration pane. |
|
Error Plots
Use these shortcuts on the error plots to analyze the data. Operations on any of the three error plots affect the corresponding error bars on all three plots.
| Task | Action |
|---|---|
| Select the error bar left of the currently selected error bar. | Left arrow |
| Select the error bar right of the currently selected error bar. | Right arrow |
| Select the error bar right or left of the currently selected error bar, in addition to the currently selected error bar. | Hold Shift and press the left arrow or right arrow |
Select multiple error bars. | Hold Ctrl and click error bars |
| Select all error bars. | Ctrl+A |
| Delete the selected error bar and corresponding data pair from the data browser. The app then recalibrates the sensors. |
A dialog box appears to confirm deletion. |
Edit ROI
Shortcuts to use on the Edit ROI tab.
| Task | Action |
|---|---|
Undo ROI size change. Note The app stores only the last three sizes of the ROI, so you cannot undo more than three times in a row. | Ctrl+Z |
Redo ROI size change. | Ctrl+Y |
See Also
Apps
Functions
estimateLidarCameraTransform|estimateBoardCornersLidar|estimateBoardCornersCamera|projectLidarPointsOnImage|fuseCameraToLidar|bboxCameraToLidar|bboxLidarToCamera