Interactively Collect Code Coverage
R2026bYou can interactively measure the statement, function, decision, condition, and modified condition/decision coverage (MC/DC) of your MATLAB® source code when you run tests by using the Test Browser, MATLAB Test Manager, or Code Quality Dashboard. You can also collect data type and size coverage, which identifies the data types and sizes of inputs that tests use when calling functions and class methods. (since R2026b)
This table compares the benefits and output of the Test Browser, MATLAB Test Manager, and Code Quality Dashboard.
| Method for Collecting Coverage | Benefits | Interface for Viewing Coverage Results |
|---|---|---|
| Test Browser |
| Code coverage report, accessed from MATLAB Command Window |
| MATLAB Test Manager |
|
|
| Code Quality Dashboard |
|
|
For information about collecting coverage programmatically, see Collect Code Coverage Metrics for MATLAB Source Code.
Test Browser
To collect coverage using the Test Browser:
Open the Test Browser. For more information, see Open the Test Browser App.
Add tests to the browser by clicking the Add tests button .
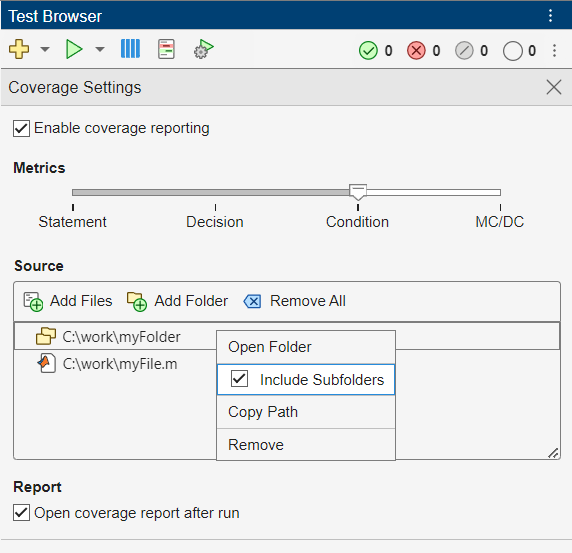
Enable coverage reporting by clicking the Open coverage settings button and selecting Enable coverage reporting.
Use the metrics slider to indicate the structural coverage metrics to include in the code coverage report. When you select a coverage type, the report includes coverage metrics up to and including that type. For example, if you select
Condition, the report includes the statement, function, decision, and condition coverage metrics.To also include data type and size coverage, select Include data type and size coverage. (since R2026b)
Specify source files under Source by clicking Add Files or Add Folder. You can include source code in the subfolders of the specified folder by right-clicking the folder path and selecting Include Subfolders.
Run the tests by clicking the Run current suite button .
To view the code coverage report, click the hyperlink in the MATLAB Command Window. To automatically open the generated code coverage report after the test run, in the Test Browser, under Report, select Open coverage report after run.
The browser generates a code coverage report for your source code based on the tests that ran. If you do not specify source code, the tests still run, but the browser does not generate a report. For more information about the browser, see Run Tests Using Test Browser.
MATLAB Test Manager
You can use the MATLAB Test Manager to collect code coverage by running all tests in the project, a specific test suite, or selected tests. To collect code coverage for all tests in the project:
Open a project that contains MATLAB source code and tests.
Open the MATLAB Test Manager. For more information, see Open the MATLAB Test Manager App.
To collect code coverage for MATLAB source code, click the Code Coverage button
 and select Enable MATLAB code
coverage.
and select Enable MATLAB code
coverage.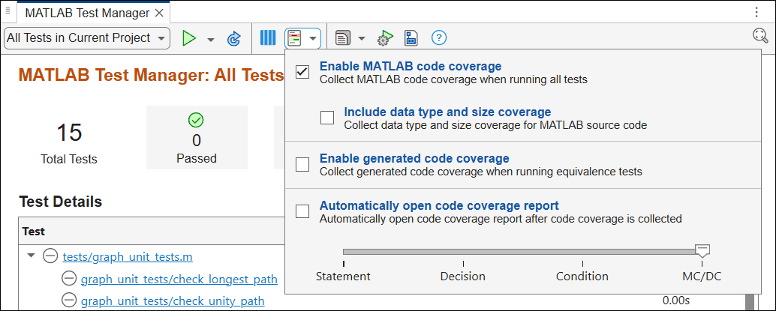
Use the metrics slider to indicate the structural coverage metrics to include in the code coverage report. When you select a coverage type, the report includes coverage metrics up to and including that type. For example, if you select
Condition, the report includes the statement, function, decision, and condition coverage metrics.To also include data type and size coverage, select Include data type and size coverage. (since R2026b)
Set the drop-down to the left of the Run button
 to
to
All Tests in Current Project.Click the Run button
.
Note
In XML projects, the
MATLAB Test Manager collects coverage for M, MLX, and MLAPP files
in the project that have the Design label. In TOML projects,
the MATLAB Test Manager collects coverage for M, MLX, and MLAPP files
not in test folders.
To collect code coverage for a test
suite, click the drop-down to the left of the Run button . Select your test suite, then click the
Run button . (since R2023b)
To collect code coverage for selected tests,
hold Shift or Ctrl and click the tests. Then, next to
the Run button , click the Expand icon  and select Run selected.
Alternatively, you can right-click one of the selected tests and select Run
selected. (since R2023b)
and select Run selected.
Alternatively, you can right-click one of the selected tests and select Run
selected. (since R2023b)
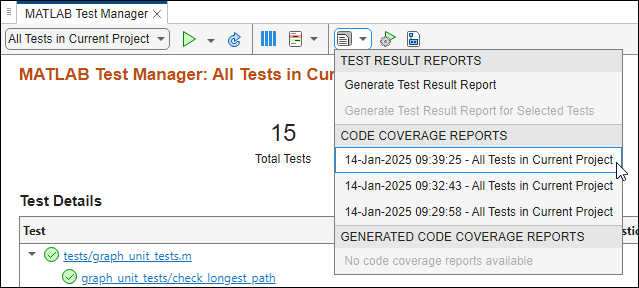
To open the code coverage report, click the Report button  , then, under MATLAB Code Coverage
Reports, select the report. The MATLAB Test Manager stores the
five most recent code coverage reports.
, then, under MATLAB Code Coverage
Reports, select the report. The MATLAB Test Manager stores the
five most recent code coverage reports.
Tip
To automatically open the code coverage report after you collect coverage,
click the Code Coverage button , then select Automatically open code coverage
report.
The Statement button displays the statement coverage percentage for the tests in the current test suite (since R2024a). To view the coverage summary for the selected coverage metrics, point to the Statement button. The coverage summary percentage includes justified missing coverage (since R2024b). For more information on justifying coverage, see Justify Missing Coverage for MATLAB Source Code.
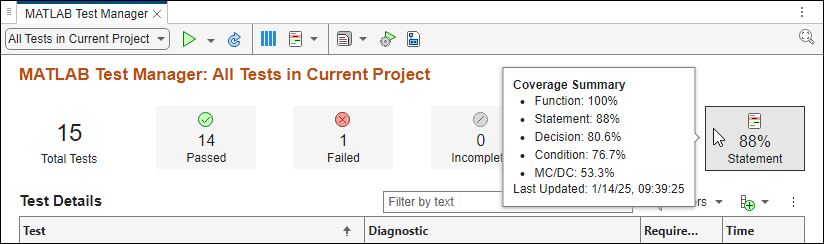
Running selected tests does not update the results in the coverage summary. To open the coverage report for the current test suite, click the Statement button.
Note
Running test suites or selected tests does not update the coverage metric results in the Code Quality Dashboard.
Additionally, if you have Embedded Coder®, you can collect coverage for generated C/C++ code that executes in SIL and PIL equivalence tests. For more information, see Collect Coverage for Generated C/C++ Code in Equivalence Tests. (since R2024b)
For more information about running tests using the test manager, see Manage Tests and Results by Using the MATLAB Test Manager.
Code Quality Dashboard
To collect coverage using the Code Quality Dashboard:
Open a project that contains MATLAB source code and tests.
Open the Code Quality Dashboard. For more information, see Open the Code Quality Dashboard App.
Run tests and collect coverage by clicking the Run button
 (since R2023b).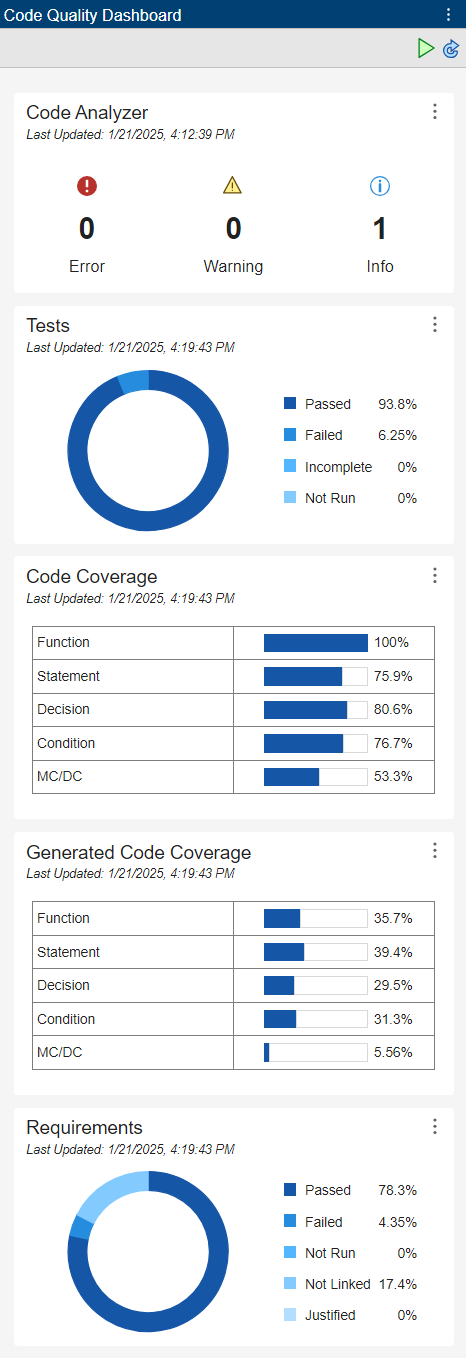
Clicking the Run button runs all tests in
the open project and its referenced projects and collects coverage according to the
coverage settings in the MATLAB Test
Manager. To change the coverage settings, open the MATLAB Test
Manager, click the Code Coverage button , and adjust the settings. For more information, see MATLAB Test Manager.
Note
Clicking the Run button enables and collects coverage for MATLAB source code even if coverage is disabled in the MATLAB Test
Manager. However, you must configure the test manager to collect
coverage for generated C/C++ code in equivalence tests.
To open the coverage report, click the MATLAB Code Coverage section title or Generated Code Coverage section title for MATLAB code coverage report or generated C/C++ code coverage report, respectively.
Additionally, if you have Embedded Coder, you can collect coverage for generated C/C++ code that executes in SIL and PIL equivalence tests. For more information, see Collect Coverage for Generated C/C++ Code in Equivalence Tests. After you collect the coverage, open the generated coverage report by clicking the table in the Generated Code Coverage section. (since R2024b)
For more information about using the Code Quality Dashboard, see Measure and Monitor Project Quality.

