Clean Messy Data and Locate Extrema Using Live Editor Tasks
You can interactively preprocess data using sequences of Live Editor tasks, visualizing the data at each step. This example uses five tasks to clean noisy data with missing values and outliers in order to identify local minima and maxima. For more information on Live Editor tasks, see Add Interactive Tasks to a Live Script.
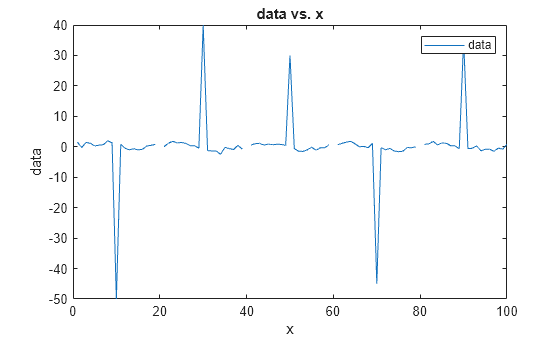
First, create and plot a vector of messy data, which contains four NaN values and five outliers.
x = 1:100;
data = cos(2*pi*0.05*x+2*pi*rand) + 0.5*randn(1,100);
data(20:20:80) = NaN;
data(10:20:90) = [-50 40 30 -45 35];
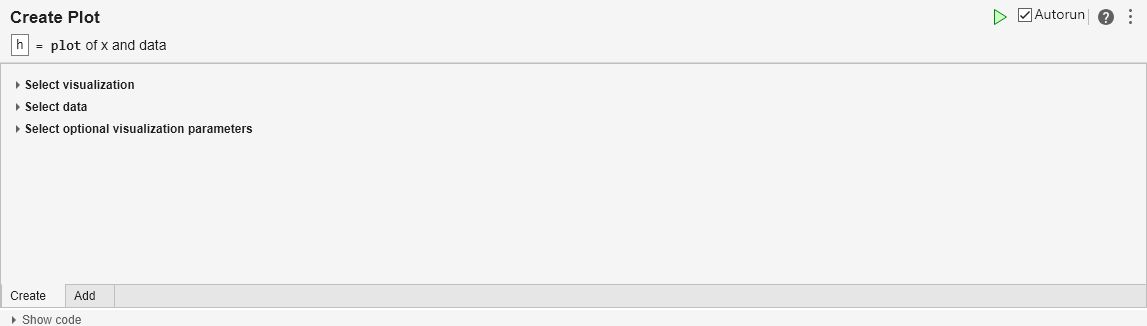
To plot the messy data, open the Create Plot task. Start by typing the keyword plot in a code block, and then click Create Plot when it appears in the menu. Select the plot type and input data to plot the data.
To see the code that this task generates, expand the task display by clicking ![]() at the bottom of the task parameter area.
at the bottom of the task parameter area.
Fill Missing Data
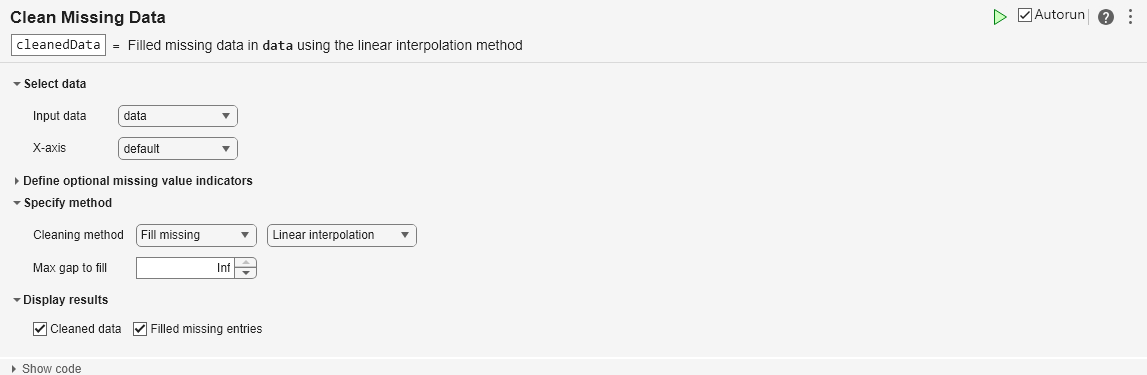
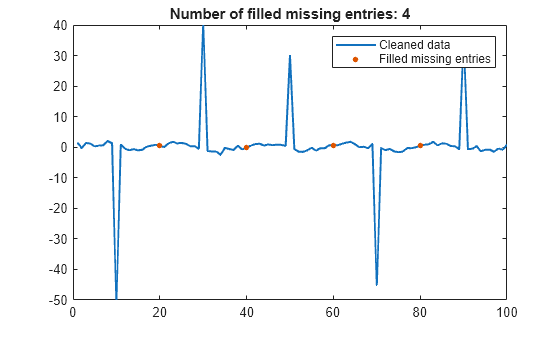
To replace NaN values in the data and visualize the results, open the Clean Missing Data task. Start by typing the keyword missing in a code block, and then click Clean Missing Data when it appears in the menu. Select the input data and the cleaning method to plot the filled data automatically.
To see the code that this task generates, expand the task display by clicking ![]() at the bottom of the task parameter area.
at the bottom of the task parameter area.
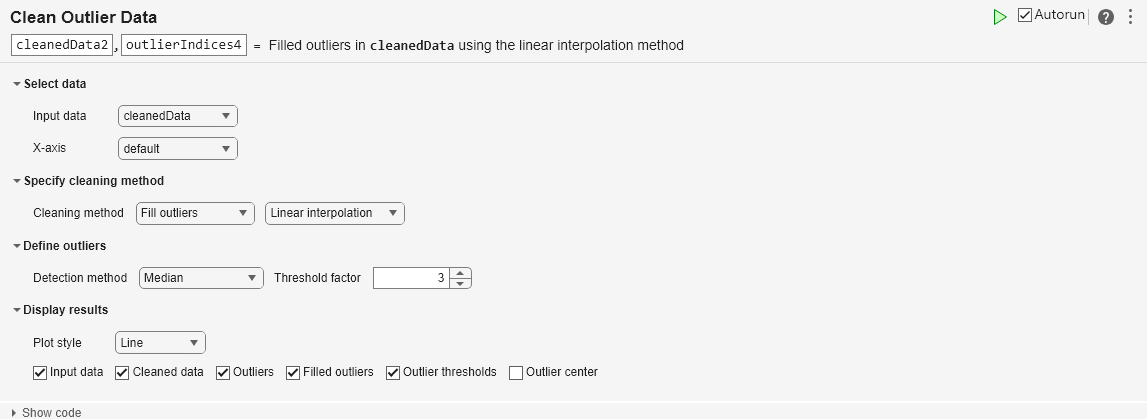
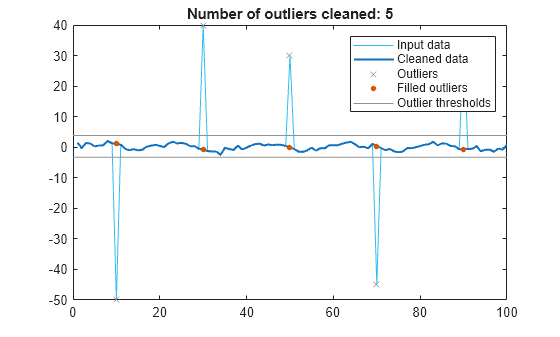
Fill Outliers
You can now remove the outliers from the cleaned data in the previous task by using the Clean Outlier Data task. Type the keyword outliers in a new code block and click Clean Outlier Data to open the task. Select cleanedData as the input data. You can customize the methods for cleaning and detecting outliers and adjust the threshold to find more or fewer outliers.
To see the code that this task generates, expand the task display by clicking ![]() at the bottom of the task parameter area.
at the bottom of the task parameter area.
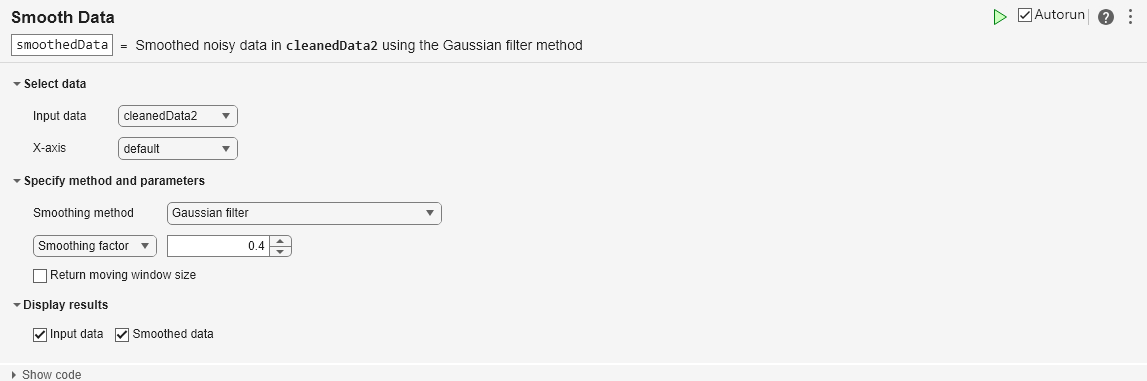
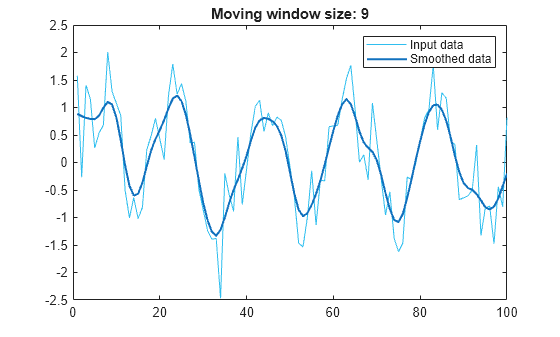
Smooth Data
Next, smooth the cleaned data from the previous task by using the Smooth Data task. Type the keyword smooth and click the task when it appears. Select cleanedData2, the output from the previous task, as the input data. Select a smoothing method, and adjust the smoothing factor for more or less smoothing.
To see the code that this task generates, expand the task display by clicking ![]() at the bottom of the task parameter area.
at the bottom of the task parameter area.
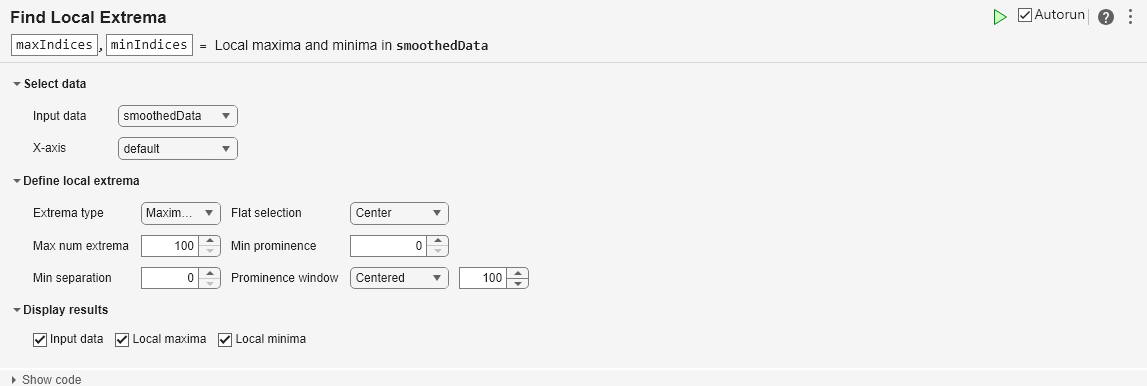
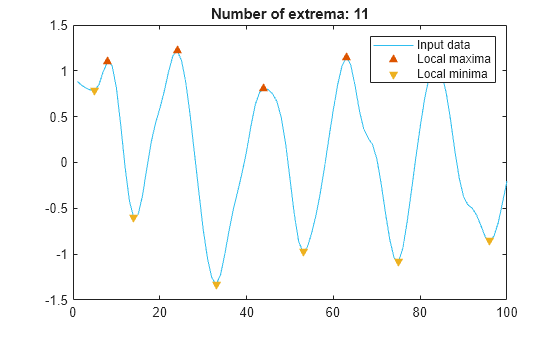
Locate Extrema
Finally, start typing the keyword extrema and click Find Local Extrema. Use smoothedData as the input data and change the extrema type to find both the local maxima and local minima of the cleaned, smoothed data. You can adjust the local extrema parameters to find more or fewer maxima and minima.
To see the code that this task generates, expand the task display by clicking ![]() at the bottom of the task parameter area.
at the bottom of the task parameter area.
See Also
Live Editor Tasks
- Clean Missing Data | Clean Outlier Data | Find Change Points | Find Local Extrema | Smooth Data | Find and Remove Trends
Functions
ismissing|rmmissing|fillmissing|isoutlier|filloutliers|rmoutliers|ischange|islocalmin|islocalmax|smoothdata