Main Content

phased.ArrayManifold

R2026b

Array manifold

Since R2026b

Description

The array manifold generates the response to incoming plane waves arriving at an array for each element as a function of azimuth, elevation, frequency, and polarization. The array manifold provides an alternative representation of an antenna array letting you use tabulated array manifold data with Phased Array System Toolbox™ functions and System objects. The array manifold models array properties including geometry, element patterns, and mutual coupling.

To use an array manifold:

  1. Create the phased.ArrayManifold object and set its properties.

  2. Call the object with arguments, as if it were a function.

To learn more about how System objects work, see What Are System Objects?

Creation

Description

manifold = phased.ArrayManifold creates a phased.ArrayManifold System object™ with default property values.

example

manifold = phased.ArrayManifold(manifolddata,AzAngles,ElAngles,freqs) creates an array manifold with the Manifold property set to manifolddata, the AzimuthAngles property set to AzAngles, the ElevationAngles property set to ElAngles, and the FrequencyVector property set to freqs.

Example: manifold = phased.ArrayManifold(array,-180:180,-90:90,300e6)

manifold = phased.ArrayManifold(name=value) creates an array manifold System object with each property name set to a specified value. You can specify additional name-value arguments in any order as (name1=value1,...,nameN=valueN).

Example: manifold = phased.ArrayManifold(Manifold=array,AzimuthAngles=-85:85)

Properties

expand all

Unless otherwise indicated, properties are nontunable, which means you cannot change their values after calling the object. Objects lock when you call them, and the release function unlocks them.

If a property is tunable, you can change its value at any time.

For more information on changing property values, see System Design in MATLAB Using System Objects.

Array manifold, specified as an N-by-M-by-P-by-L complex-valued MATLAB array. The object assumes that manifold elements lie on a regular azimuth-elevation-frequency grid.

  • N is the number of AzimuthAngles grid points

  • M is the number of ElevationAngles grid points

  • P is the number of FrequencyVector grid points

  • L is the number of array elements

For example, each slice of the manifold manifold(:,m,l,p) corresponds to manifold values for all azimuth angles for the mth elevation and lth frequency. All manifold values must be finite.

Data Types: single | double
Complex Number Support: Yes

Azimuth angle points, specified as a real length-N vector. N represents the number of azimuth angles in the Manifold property. Azimuth angle values are in ascending order and must lie between -180° and 180°.

Specify the AzimuthAngles property as [] to indicate that the manifold does not depend on azimuth.

Example: [-45:45]

Data Types: single | double

Elevation angles grid, specified as a real length-M vector. M represents the number of elevation grid points in the Manifold property. Elevation values are in ascending order and must lie between -90° and 90°.

Specify the ElevationAngles property as [] to indicate that the manifold does not depend on elevation.

Example: [-45:45]

Data Types: single | double

Frequency vector, specified as a length-P real, positive-valued vector. P represents the number of frequencies in the Manifold property.

Specify the FrequencyVector property as empty [] to indicate that the manifold does not depend on frequency.

Data Types: single | double

Usage

Description

val = manifold(freq,angle) returns the array manifold value, val, evaluated at the specified frequencies freq and directions angle.

Input Arguments

expand all

Frequencies, specified as a real positive-valued length-P vector. Each value must be finite and nonnegative. Units are in Hz.

Data Types: single | double

Direction angles, specified as a real-valued, 1-by-R vector, or real-valued, 2-by-R matrix where R is the number of requested directions. Specify directions as azimuth angles only or as azimuth-elevation pairs.

  • 1-by-R – Specify only the azimuth angles. The object assumes elevation is zero degrees.

  • 2-by-R – Specify azimuth and elevation pairs in the form [azimuth;elevation].

Units are in degrees.

Data Types: single | double

Output Arguments

expand all

Manifold values at specified directions and frequencies, returned as a complex-valued MATLAB array.

Data Types: single | double

Object Functions

To use an object function, specify the System object as the first input argument. For example, to release system resources of a System object named obj, use this syntax:

release(obj)

expand all

patternPlot array directivity and patterns from array manifold
directivityCompute array manifold directivity
getNumElementsNumber of elements in an array
isPolarizationCapableArray polarization capability
stepRun System object algorithm
releaseRelease resources and allow changes to System object property values and input characteristics
resetReset internal states of System object

Examples

collapse all

Create a phased.ArrayManifold System object™ and evaluate the manifold values in multiple directions.

First, set up the azimuth angle, elevation angle, and frequency grids.

az = -180:10:180;
el = -90:10:90;
fc = [0 1e9 2e9];
manval = complex(ones(numel(az),numel(el),numel(fc),8));

Create the array manifold.

man1 = phased.ArrayManifold(manval,az,el,fc);

Evaluate the manifold at two frequencies and two directions.

M1 = man1([0 1e9],[30 40; 0 10])
M1 = 
M1(:,:,1) =

     1     1
     1     1
     1     1
     1     1
     1     1
     1     1
     1     1
     1     1


M1(:,:,2) =

     1     1
     1     1
     1     1
     1     1
     1     1
     1     1
     1     1
     1     1

Create a second frequency-invariant manifold.

man2 = phased.ArrayManifold( ...
    manval(:,:,1,:),az,el,[]);

Frequency query values are ignored for frequency-invariant data.

M2 = man2([0 1e9 2e9],[0;0]);

Use the directivity object function to compute the directivity of the second manifold at az=-90 degrees and el=10 degrees.

[az(10),el(11)]
ans = 1×2

   -90    10

directivity(man2,fc(2),[az(10);el(11)])
ans = 
1.1025e-04

Using the pattern object function, plot the directivity pattern of the array manifold.

pattern(man2,fc(2)) 
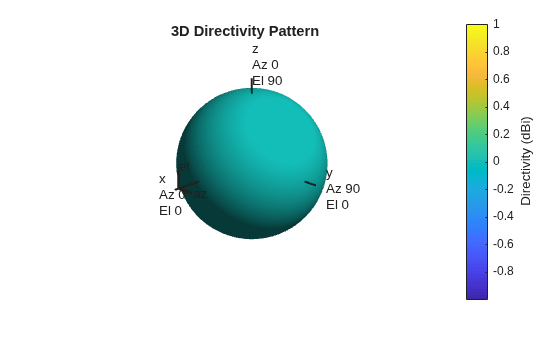
Figure contains an axes object. The hidden axes object with title 3D Directivity Pattern contains 13 objects of type surface, line, text, patch.

Extended Capabilities

expand all

C/C++ Code Generation
Generate C and C++ code using MATLAB® Coder™.

Version History

Introduced in R2026b