Import Data from Workspace or File into Simulation Data Inspector
R2026bYou can import data into the Simulation Data Inspector from the base workspace or from a file. Use the Simulation Data Inspector to view imported data on its own or alongside other simulation data.
The Simulation Data Inspector supports all built-in data types and many data formats, such
as Dataset, timeseries, and
timetable, for importing data from the workspace. Regardless of the
format, sample values generally must be paired with sample times. The Simulation Data
Inspector supports up to 8000 channels per signal in a run created from imported workspace
data.
You can import data from many different types of files, including:
MAT files
CSV files — Format data as shown in CSV File Format for Simulation Data.
Parquet files (since R2026b) — Format data as described in Parquet File Format for Simulation Data.
Microsoft® Excel® files — Format data as described in Microsoft Excel Import, Export, and Logging Format.
MDF files — The Simulation Data Inspector supports MDF file import on Linux® and Windows® operating systems. The MDF file must have a
.mdf,.mf4, or.datfile extension and contain only integer, floating-point, or string data types in the MDF file channels.ULG (ULog) files — To import flight log data, you need a UAV Toolbox license.
ROS (Robot Operating System) Bag files — The Simulation Data Inspector supports ROS Bag file import for file versions 1.1 and 2.0. Bag file import requires a ROS Toolbox license.
To import data into the Simulation Data Inspector, click Import
 to open the Import dialog box or use one of these functions:
Simulink.sdi.createRun— Import data into a new run and return the run ID.Simulink.sdi.Run.createSimulink.sdi.addToRun
To import data from a format that the Simulation Data Inspector does not support, write a
custom reader using the io.reader class. You can also write a custom reader
to replace the built-in reader for supported file types. For examples, see:
Import Data From Workspace
You can import time-based data from the workspace into the Simulation Data Inspector. Create timeseries objects that contain data for a sine signal and a cosine signal. Give each timeseries object a descriptive name.
time = 0:0.1:10;

sinVals = sin(time);
cosVals = cos(time);

sinTS = timeseries(sinVals,time,"Name","Sine");
cosTS = timeseries(cosVals,time,"Name","Cosine");
Open the Simulation Data Inspector.
Simulink.sdi.view
To import data interactively, in the Simulation Data Inspector, select Import  . In the Import dialog box, you can choose to import data from the workspace or from a file. The table below the options shows data available for import. If you do not see your workspace variable or file contents in the table, that means the Simulation Data Inspector does not have a built-in or registered reader that supports that data. You can select which data to import using the check boxes, and you can choose whether to import that data into an existing run or a new run. To select all or none of the data, use the check box next to NAME.
In the Import dialog box:
Under Import from, select Base workspace.
Under To, select New run.
In the signal table, select the
SineandCosinesignals.Click Import.
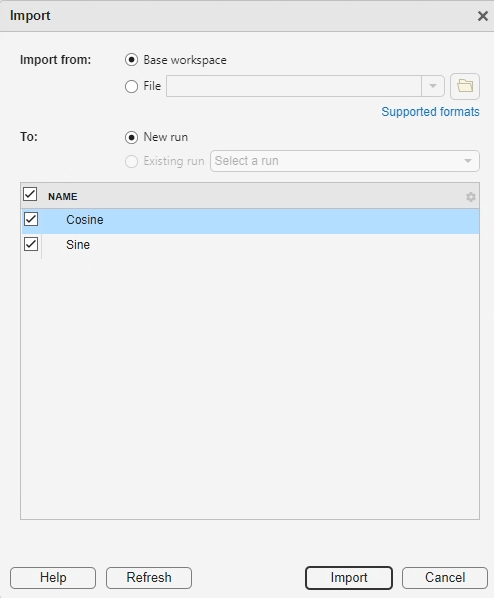
When you import data into a new run, the run always appears in the work area. You can manually move imported runs to the archive.
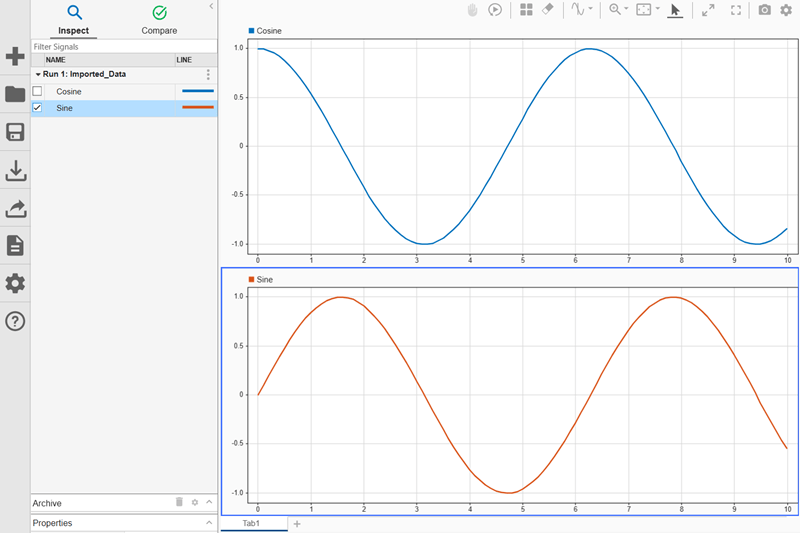
Select signals from the signal table to view data in the Simulation Data Inspector. To create two vertically aligned subplots, click Visualizations and layouts  . Then, under Basic layouts, select a
 2x1 subplot layout. Plot the Cosine signal in the upper subplot and plot the Sine signal in the lower subplot.
Import Data from File
The MAT file fuelsysRunData contains signal data from one run of the sldemo_fuelsys model. For more information about the model, see Model Fault-Tolerant Fuel Control System.
Open the Simulation Data Inspector.
Simulink.sdi.view
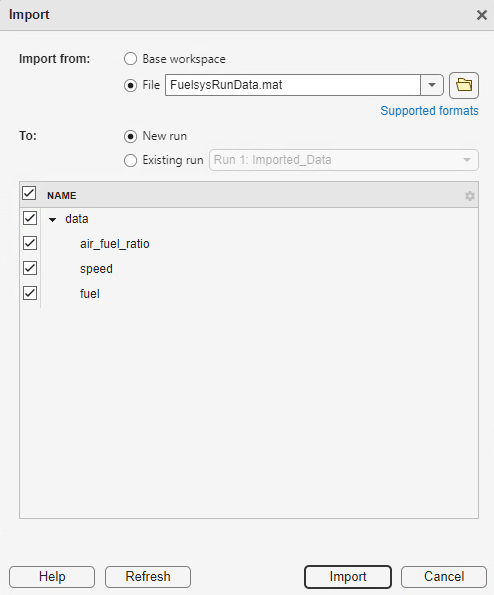
To import data from the fuelsysRunData file into the Simulation Data Inspector, click Import  . In the Import dialog box:
Under Import from, select File. Then, type the file name or navigate the file system to select the
FuelsysRunDatafile.Under To, select New run.
In the signal table, select the checkbox next to NAME to select all the signals.
Click Import.
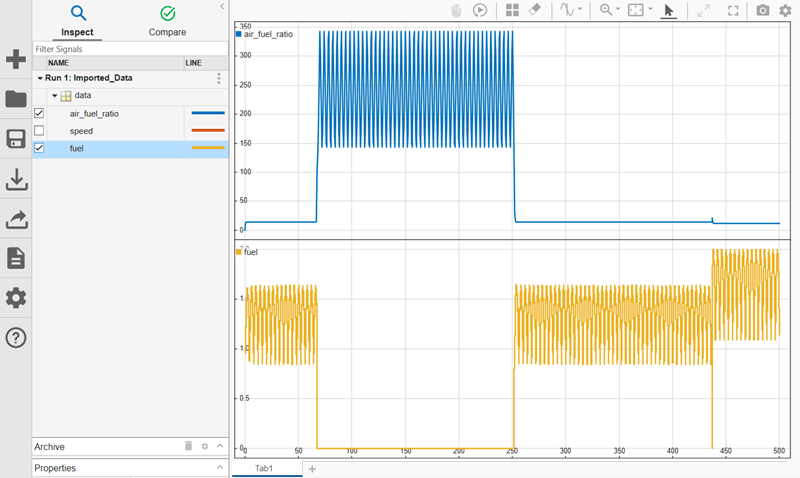
In the Simulation Data Inspector, use the sparklines visualization to view the data. Click Visualizations and layouts  . Then, under Visualizations, select Sparklines. Select
 air_fuel_ratio and fuel from the signal table to view them in the sparklines plot.
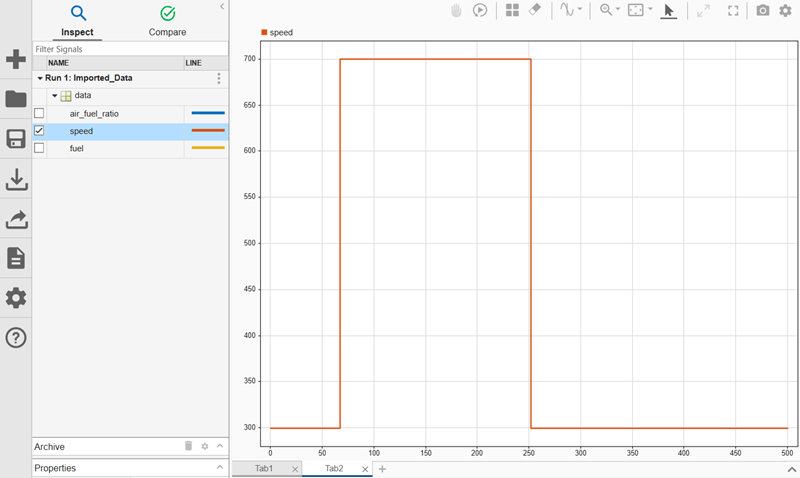
To visualize the speed signal in a separate view, open a new tab. Click the New tab  button. Then select
 speed signal.
See Also
Functions
Simulink.sdi.createRun|Simulink.sdi.Run.create|Simulink.sdi.addToRun|Simulink.sdi.Parquet.getSignalMetadata|Simulink.sdi.Parquet.getHierarchyDataset|Simulink.sdi.view

