Inspect Data Programmatically
R2026bYou can harness the capabilities of the Simulation Data Inspector programmatically from the MATLAB® command line.
The Simulation Data Inspector organizes data in runs and signals, assigning a unique
numeric identifier to each run and signal. The Simulink.sdi.Run and Simulink.sdi.Signal objects allow you to
access to your data and view and modify run and signal metadata. When you interact with the
Simulation Data Inspector programmatically, some functions require Signal
or Run objects as inputs, while others use signal or run IDs. This table
lists some ways to access these objects and IDs.
| Action | Function | Input Required |
|---|---|---|
| Access run ID | Simulink.sdi.getAllRunIDs | None |
Simulink.sdi.getRunIDByIndex | Index of run in Simulation Data Inspector repository | |
Access Simulink.sdi.Run object | Simulink.sdi.Run.getLatest | None |
Simulink.sdi.getCurrentSimulationRun | Model name | |
Simulink.sdi.getRun | Run ID | |
| Access signal ID | getAllSignalIDs | Run object |
getSignalIDByIndex | Run object and index of signal in the run | |
getSignalIDsByName | Run object and signal name | |
Access Simulink.sdi.Signal object | getAllSignals | Run object |
getSignalByIndex | Run object and index of signal in the run | |
getSignalsByName | Run object and signal name | |
Simulink.sdi.getSignal | Signal ID |
You can modify the Simulation Data Inspector preferences using functions like Simulink.sdi.setSubPlotLayout, Simulink.sdi.setRunNamingRule, and Simulink.sdi.setVisualization. To restore the Simulation Data Inspector
default settings, use Simulink.sdi.clearPreferences.
Create Run and View Data
Create a run, add data to it, and then view the data in the active tab of the Simulation Data Inspector.
Create Data for Run
Create two timeseries objects to contain data for a sine signal and a cosine signal. Give each timeseries object a descriptive name.
time = linspace(0,20,101);

sine_vals = sin(2*pi/5*time);
sine_ts = timeseries(sine_vals,time);
sine_ts.Name = "Sine, T=5";

cos_vals = cos(2*pi/8*time);
cos_ts = timeseries(cos_vals,time);
cos_ts.Name = "Cosine, T=8";
Create Run and Add Data
To open the Simulation Data Inspector, use Simulink.sdi.view.
Simulink.sdi.view
To import data into the Simulation Data Inspector from the workspace, create a Simulink.sdi.Run object using Simulink.sdi.Run.create. Add metadata information using the Name and Description properties of the Run object.
sinusoidsRun = Simulink.sdi.Run.create;
sinusoidsRun.Name = "Sinusoids";
sinusoidsRun.Description = "Sine and cosine signals with different frequencies";
Add the data you created in the workspace to the empty run.
add(sinusoidsRun,"vars",sine_ts,cos_ts);0.091530s wall, 0.156250s user + 0.031250s system = 0.187500s CPU (204.9%)
Plot Data in Simulation Data Inspector
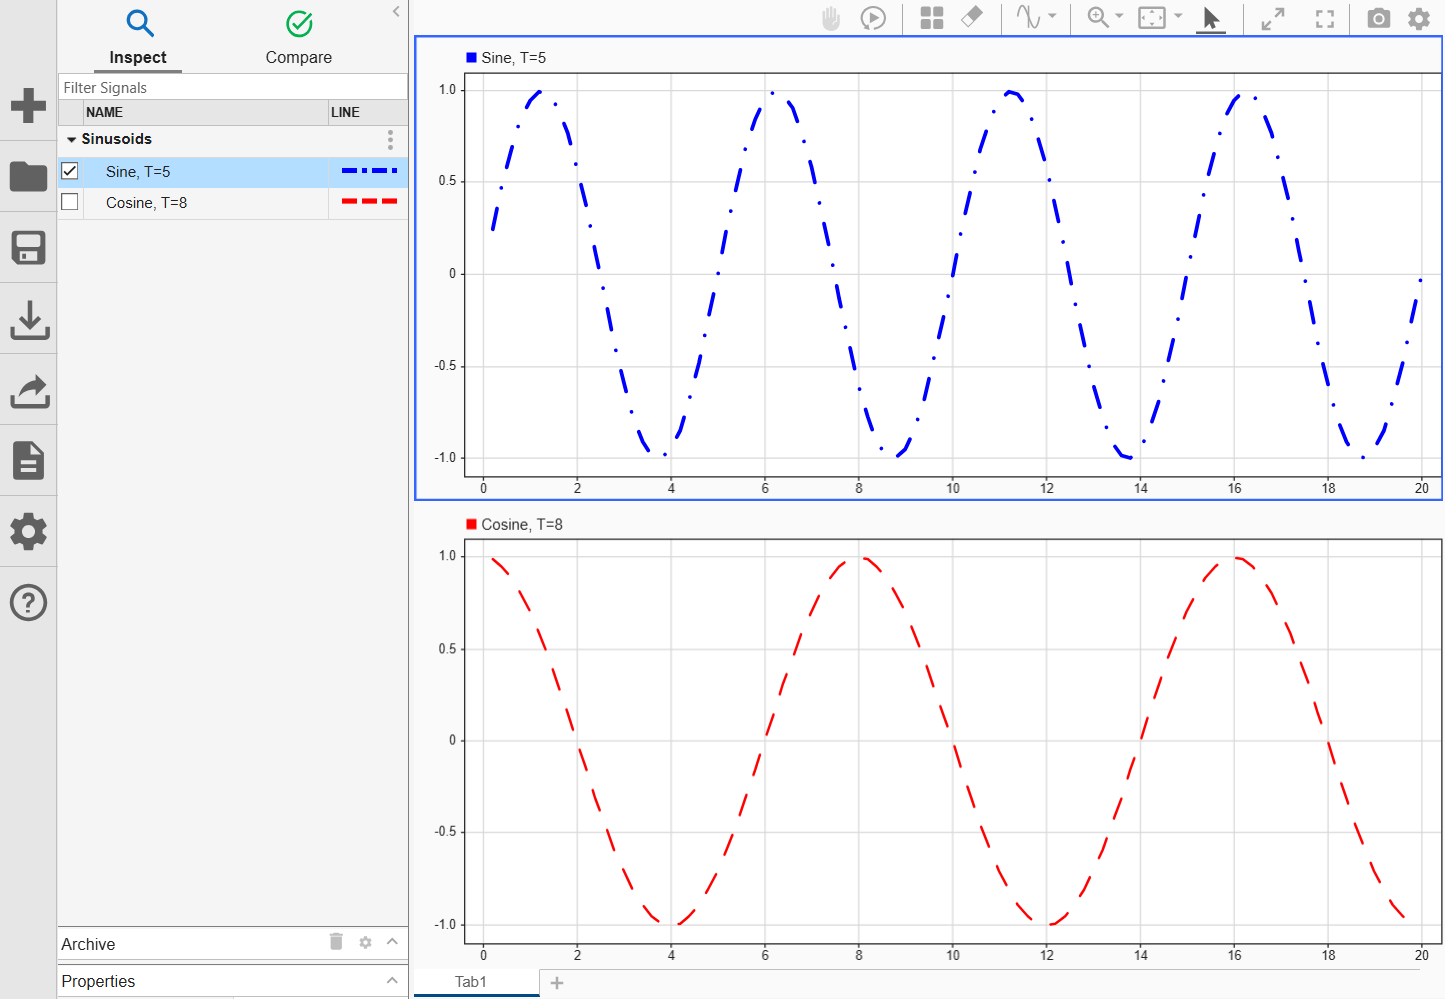
To access the Simulink.sdi.Signal object corresponding to each signal, use getSignalByIndex. You can use the Simulink.sdi.Signal object properties to specify the line style and color for the signal and plot the signal in the Simulation Data Inspector. For example, specify the LineColor and LineDashed properties for each signal.
sine_sig = getSignalByIndex(sinusoidsRun,1);
sine_sig.LineColor = [0 0 1];
sine_sig.LineDashed = "-.";

cos_sig = sinusoidsRun.getSignalByIndex(2);
cos_sig.LineColor = [1 0 0];
cos_sig.LineDashed = "--";
To configure a 2-by-1 subplot layout in the active tab of the Simulation Data Inspector plotting area, use Simulink.sdi.setSubPlotLayout. To plot the sine signal on the upper subplot and the cosine signal on the lower subplot, use plotOnSubPlot.
Simulink.sdi.setSubPlotLayout(2,1);

plotOnSubPlot(sine_sig,1,1,true);
plotOnSubPlot(cos_sig,2,1,true);
Inspect Data Using Cursors
To access the value of a signal at a specific time, you can add a cursor to the plot. For example, the Sine signal appears to have a local maximum at about 6 seconds. Add one cursor to the plot and observe the signal value at 6 seconds.
Simulink.sdi.setNumCursors(1)
Simulink.sdi.setCursorPositions("left",6)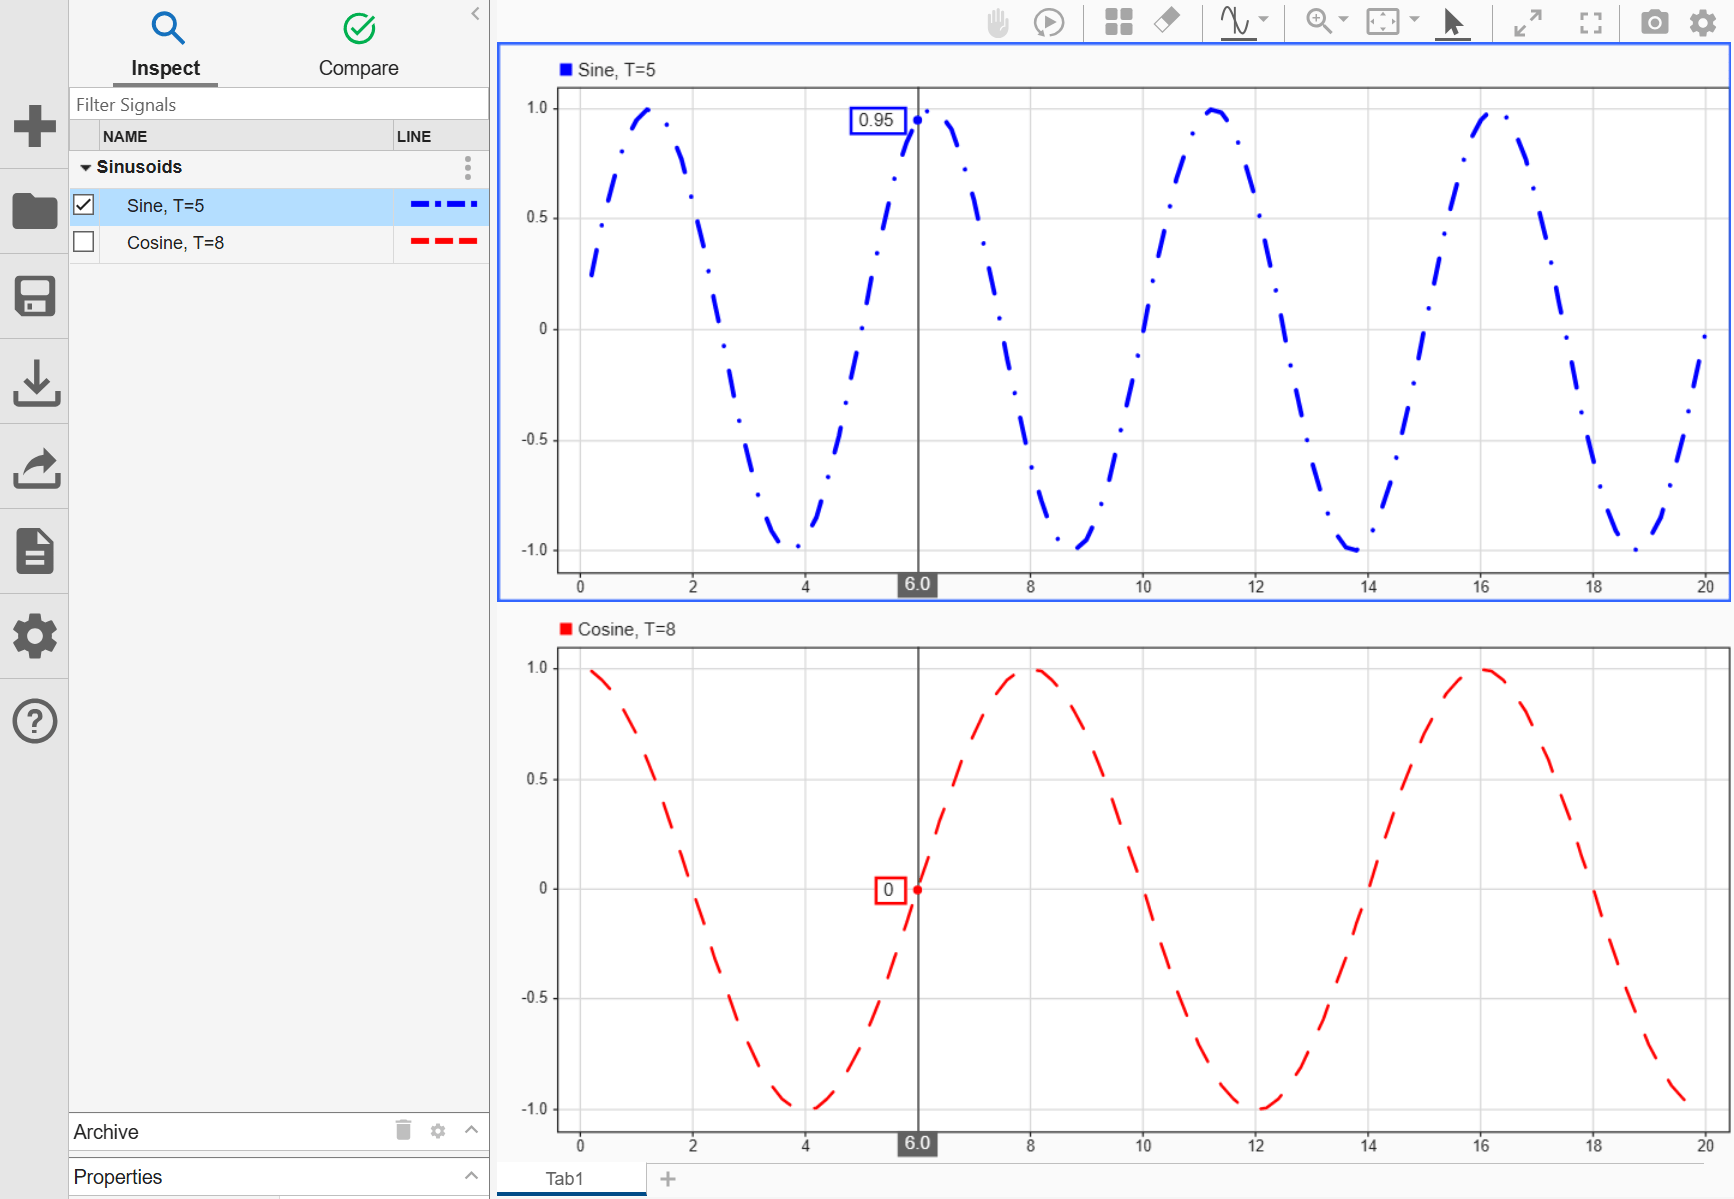
To measure the time difference between two points or extract descriptive statistics within the defined interval, add two cursors.
Simulink.sdi.setNumCursors(2)
Simulink.sdi.setCursorPositions("left",5,"right",7)
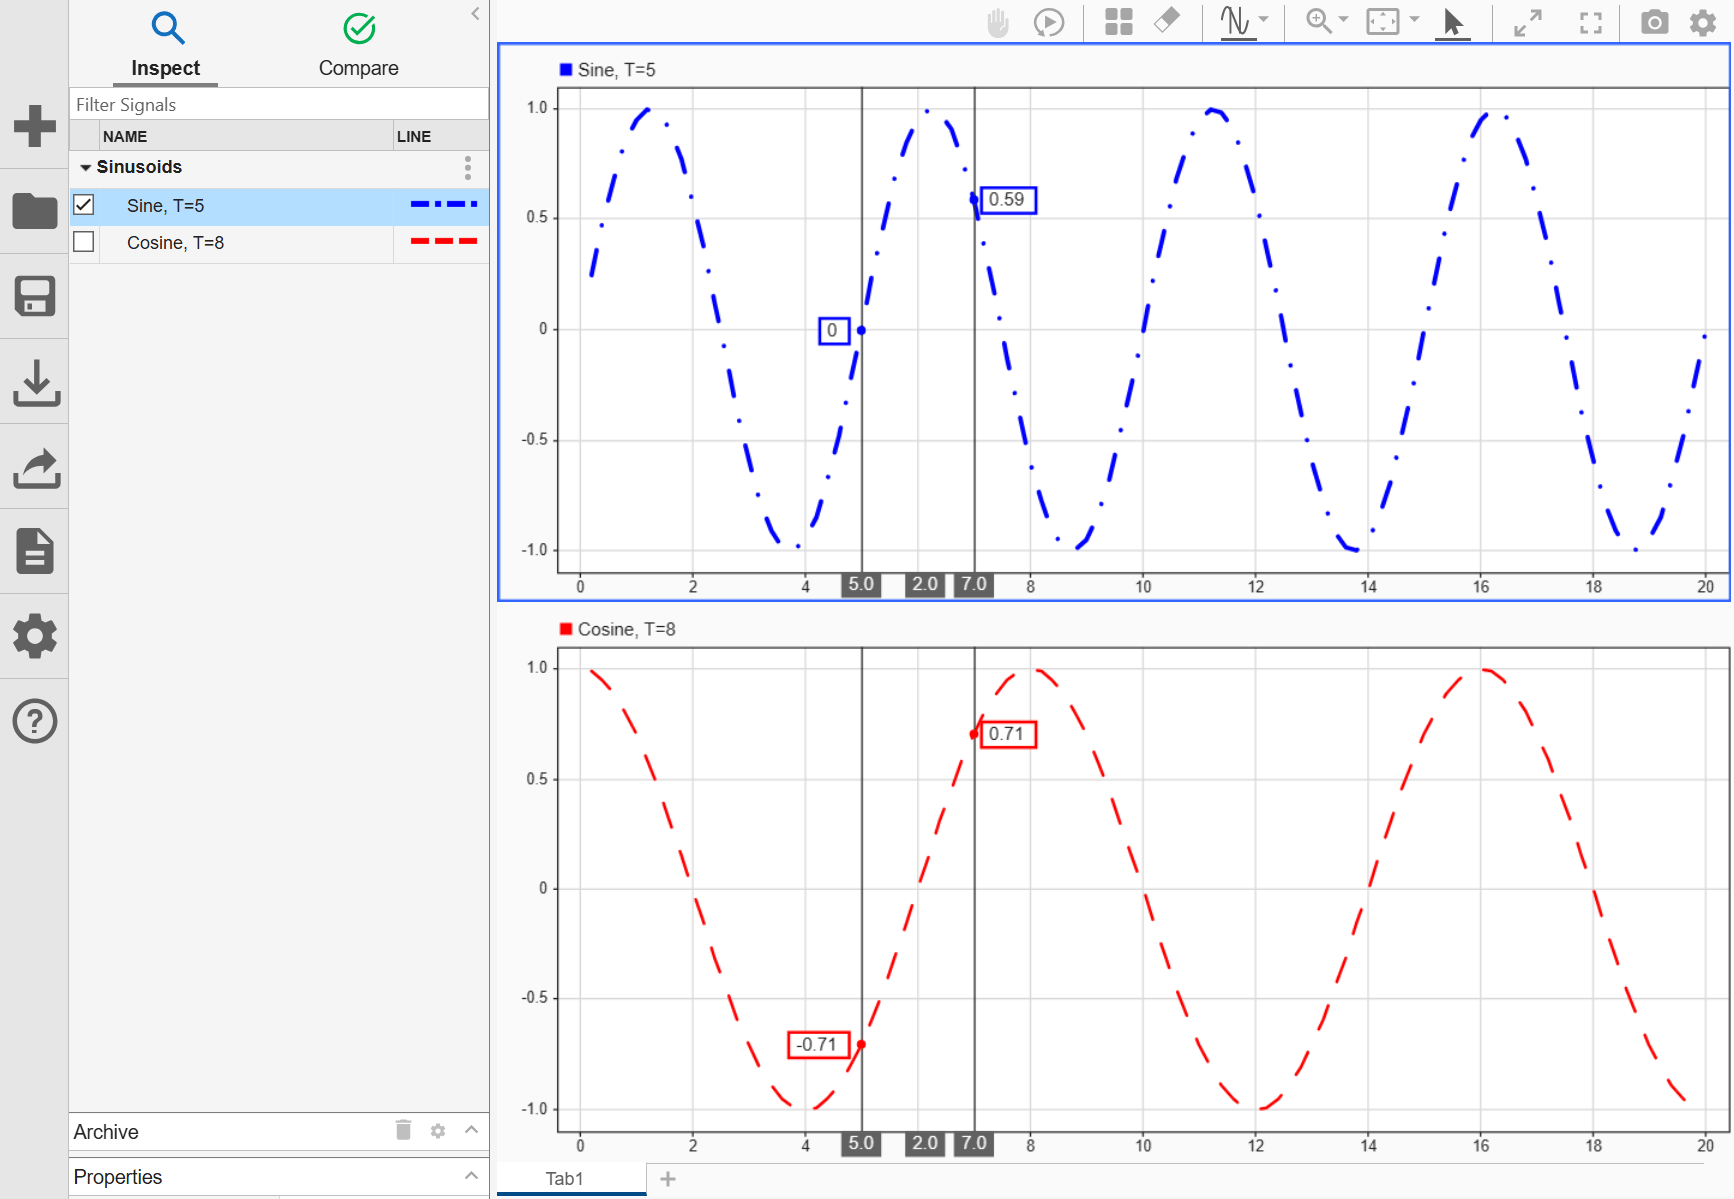
Determine the local maximum sample value in the Sine signal between the cursors using the max function.
[t1,t2] = Simulink.sdi.getCursorPositions;
localMax = max(sine_sig,t1,t2)
localMax =
0.9980
Close Simulation Data Inspector and Save Data
When you finish inspecting the plotted signal data, you can close the Simulation Data Inspector and save the session to an MLDATX file.
Simulink.sdi.close("sinusoids.mldatx")
