Test and Measurement
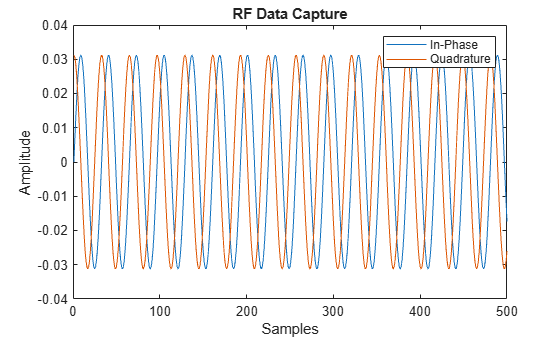
Generate waveforms and use quantitative tools to measure system performance. Use graphical utilities such as constellation and eye diagrams to visualize the effects of various impairments and corrections.
Supported file formats to process captured signals include binary baseband signal and NI™ technical data management solution (TDMS) format files. You can read data into tables or timetables by reading TDMS-files individually, or by reading collections of TDMS-files simultaneously.
Apps
| Wireless Waveform Generator | Create, impair, visualize, and export modulated waveforms |
| Bit Error Rate Analysis | Analyze BER performance of communications systems |
Functions
Objects
Blocks
Topics
- Bit Error Rate Analysis Techniques
Obtain bit error rate results and statistics.
- Analyze Performance with Bit Error Rate Analysis App
Learn how to use the Bit Error Rate Analysis app.
- Compute BER for QAM System with AWGN Using MATLAB
Demonstrate computational and visualization tools that enable you to use higher level functions when simulating communications systems.
- Create Waveforms Using Wireless Waveform Generator App
Create, impair, visualize, and export modulated waveforms.
- ACPR Measurements Using WCDMA Signal
Obtain adjacent channel power ratio (ACPR) measurements using a WCDMA communications signal.
- Measure Modulation Accuracy
Learn about EVM and MER for measuring modulation accuracy.
- Scatter Plots and Constellation Diagrams
Display digitally modulated signals in the IQ-plane.
- Visualize RF Impairments
Apply various RF impairments to a QAM signal.
- Plot Signal Constellations
Show different ways to view the reference constellation for modulated signals.
- VITA 49 Packet Format
Explore the packet format of VITA 49 file.
- Selected Bibliography for Measurements
List of references for further reading.
Related Information
Featured Examples
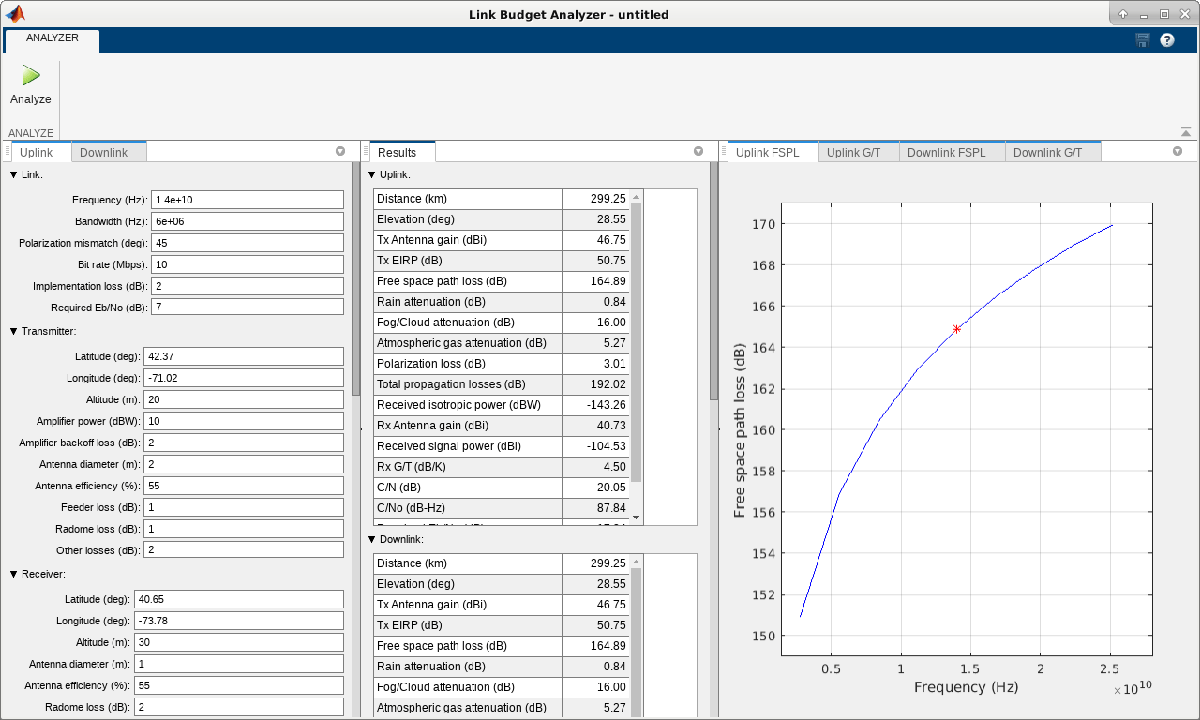
Link Budget Analysis
Demonstrate analyze link budgets in the design of wireless communications links between two sites considering issues of range, throughput, and received signal quality of critical importance to the system engineer.
Measure EVM for 802.15.4 (ZigBee) System
Measure EVM of simulated IEEE 802.15.4 transmitter.
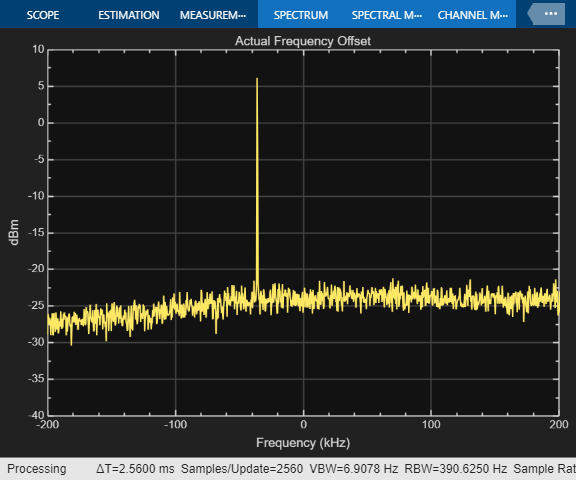
Frequency Offset Calibration for Receivers
At the receiver, measure and calibrate to remove the frequency offset between a transmitter and a receiver.
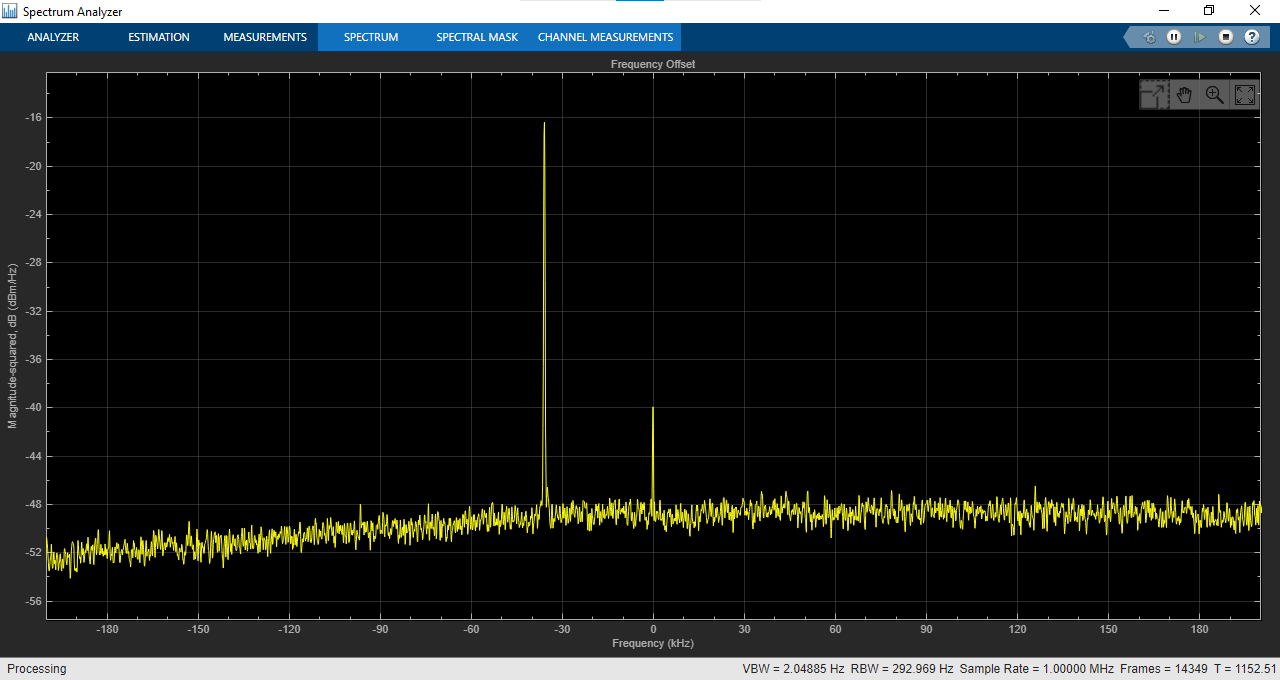
Frequency Offset Calibration for Receivers in Simulink
Measure and calibrate for transmitter/receiver frequency offset at the receiver in a Simulink simulation.
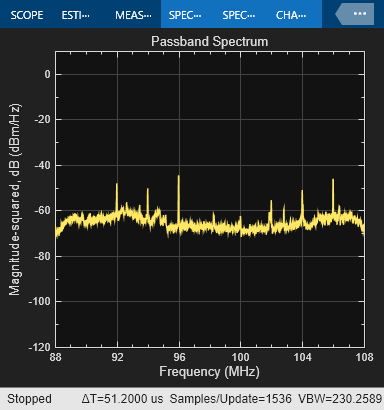
Spectrum Analysis of Signals
Downstream spectrum analysis of signals using MATLAB®, Communications Toolbox™ and DSP System Toolbox™.
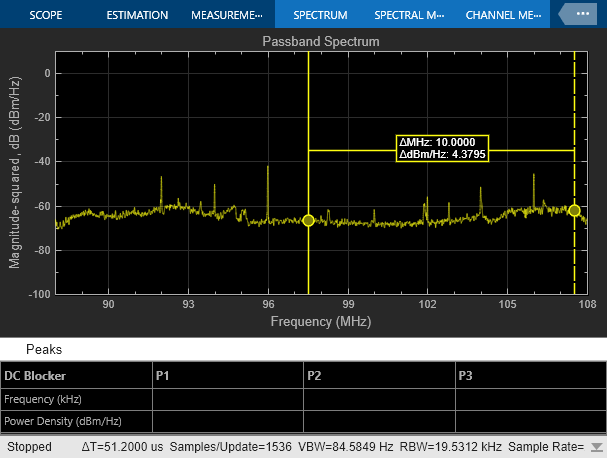
Spectrum Analysis of Signals in Simulink
Use the captured signals, or receive signals in real time using RTL-SDR, ADALM-PLUTO or USRP™ radio, as a data source for downstream spectrum analysis with MATLAB and Simulink®.
VITA 49 File Reader
Read signal time data packets and the associated metadata (context packet data) from a VITA 49 format file.