Simulation Data Inspector
R2026bInspect and compare data and simulation results to validate and iterate model designs
Description
The Simulation Data Inspector visualizes and compares multiple kinds of data.
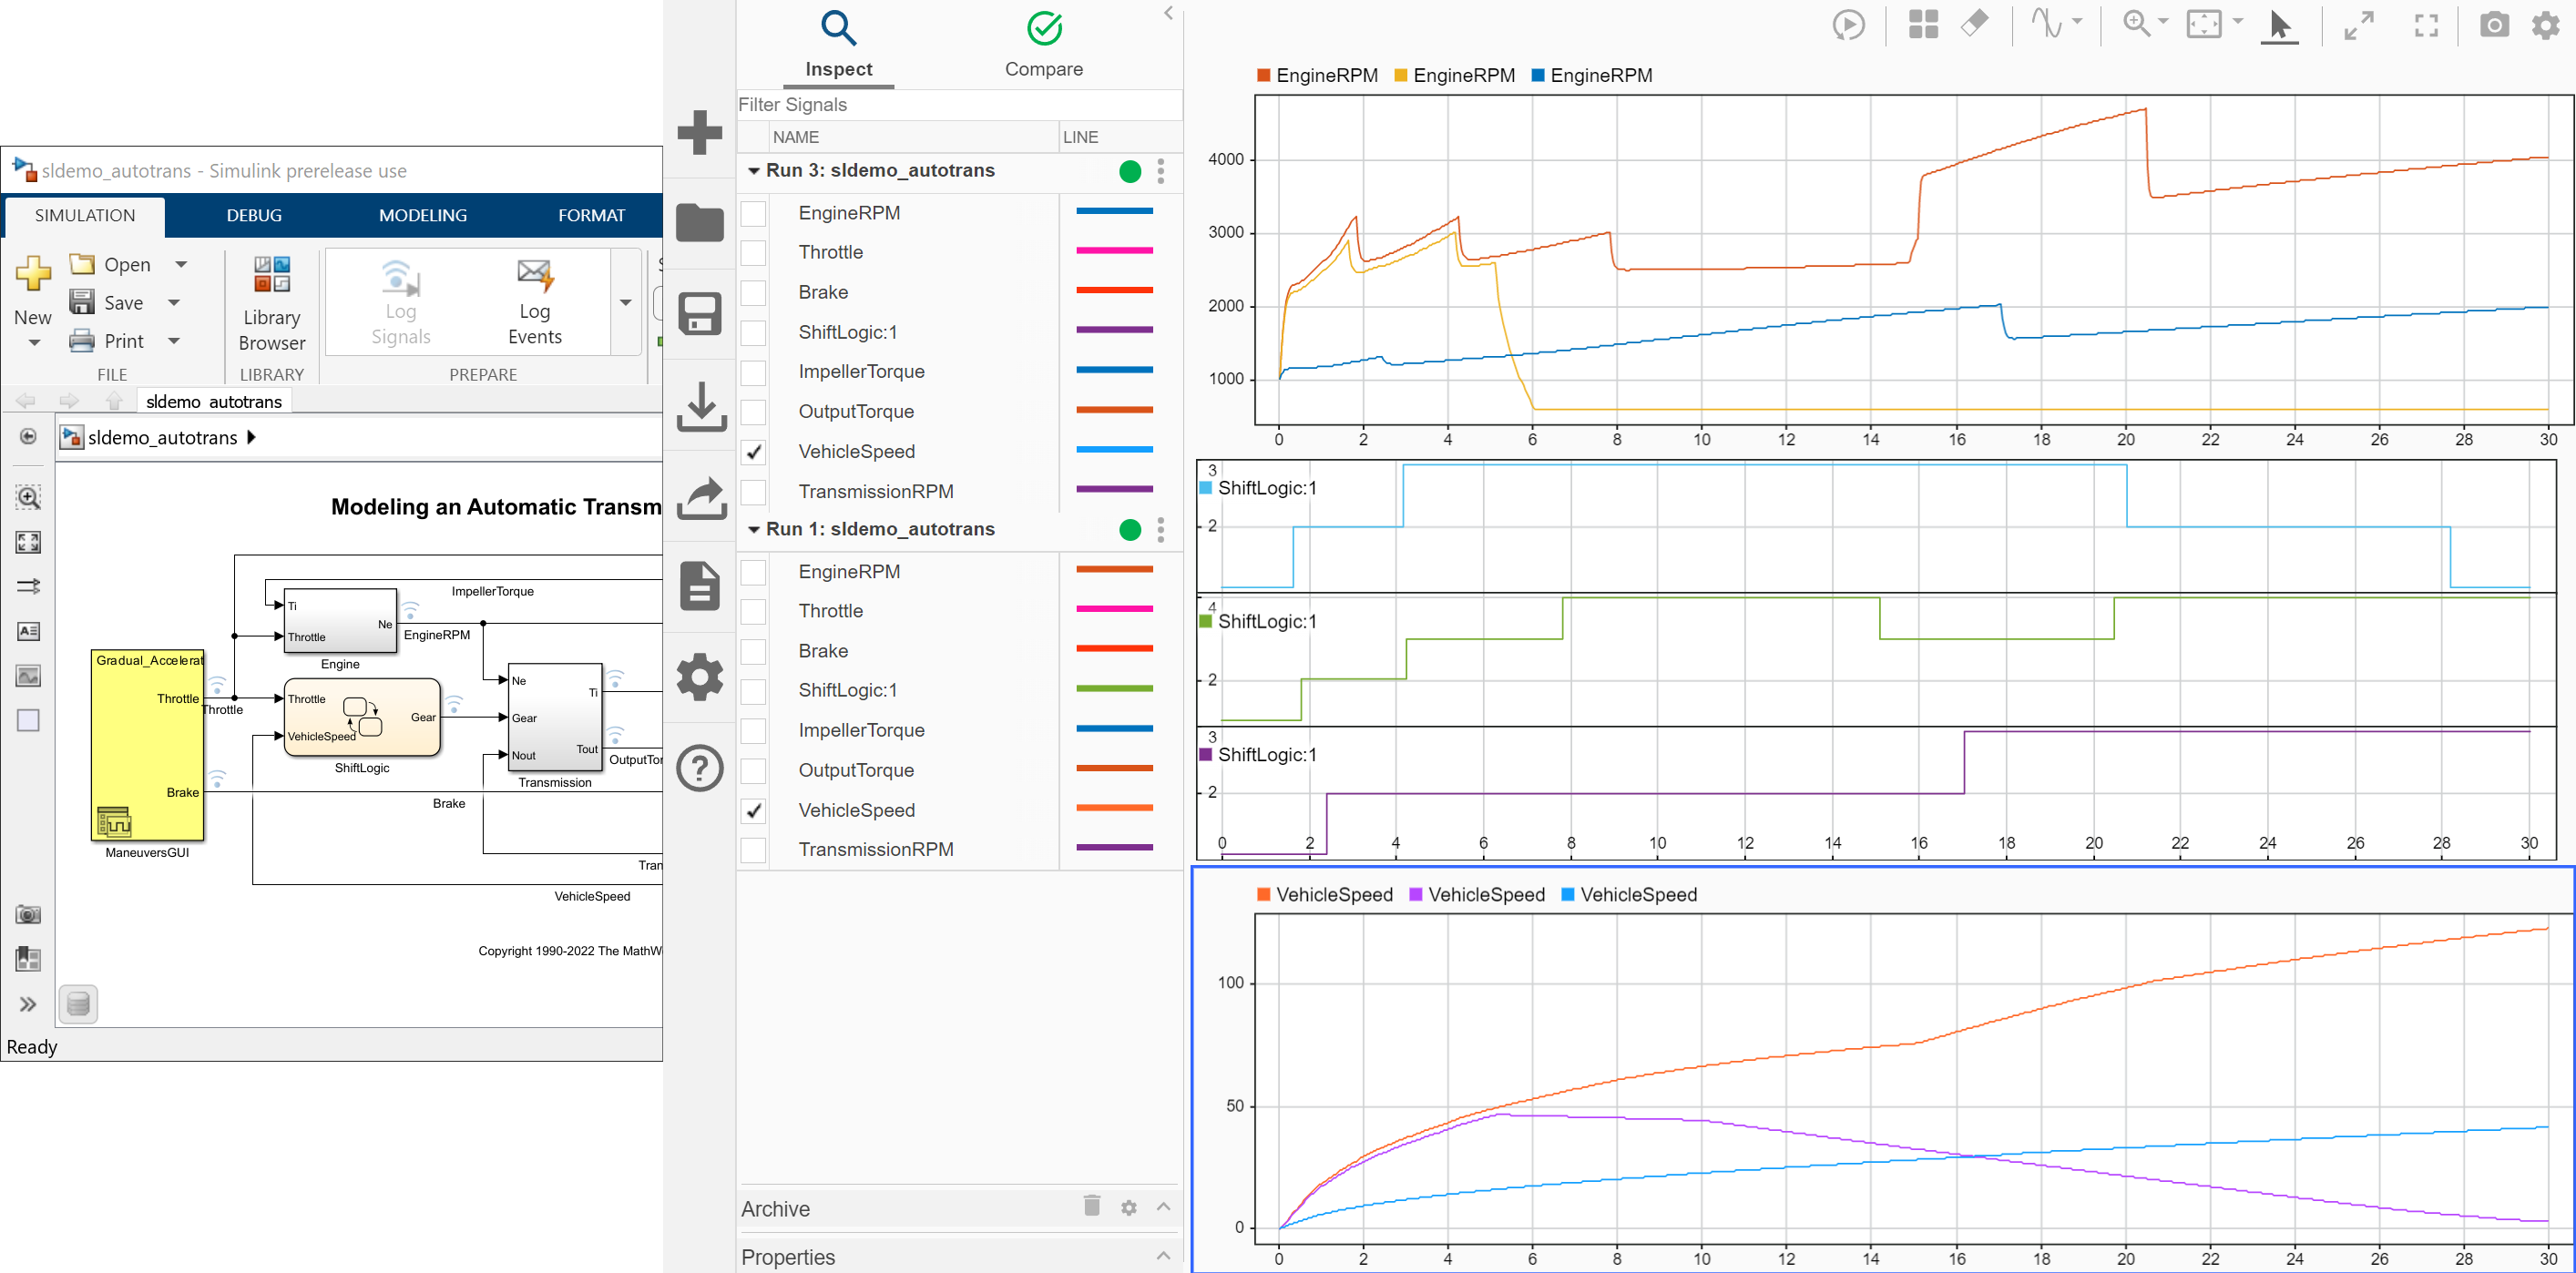
Using the Simulation Data Inspector, you can inspect and compare time series data at multiple stages of your workflow. You can also use tabs (since R2026b) to organize different visualizations and layouts. This example workflow shows how the Simulation Data Inspector supports all stages of the design cycle:
View Simulation Data in Simulation Data Inspector or Import Data from Workspace or File into Simulation Data Inspector
Run a simulation in a model configured to log data to the Simulation Data Inspector, or import data from the workspace or a file. You can use multiple tabs to view and verify model input data or inspect logged simulation data while iteratively modifying your model diagram, parameter values, or model configuration. For more information about logging simulation data, see Save Simulation Data.
Use multiple tabs to organize different views of your simulation data. In each tab, plot signals on multiple subplots, zoom in and out on specified plot axes, and use data cursors to understand and evaluate the data. You can choose from several visualizations, such as time, array, map, sparklines, and XY plots. For more information on presenting data effectively, see Create Plots Using Simulation Data Inspector.
Compare individual signals or simulation runs and analyze your comparison results with relative, absolute, and time tolerances. The compare tools in the Simulation Data Inspector support iterative design and allow you to highlight signals that do not meet your tolerance requirements. For more information about the comparison operation, see How the Simulation Data Inspector Compares Data.
Save and Share Simulation Data Inspector Data and Views
Share your findings with others by saving Simulation Data Inspector data and views.
You can also use the Simulation Data Inspector from the command line. For more information, see Inspect Data Programmatically and Compare Data Programmatically.
Open the Simulation Data Inspector
Simulink® Toolstrip: On the Simulation tab, under Review Results, click Data Inspector.
From a model: click the streaming badge on a signal to open the Simulation Data Inspector and plot the signal.
MATLAB® command prompt:
Type
Simulink.sdi.viewto open the Simulation Data Inspector.Use
Simulink.sdi.plotto open the Simulation Data Inspector and plot data.
Examples
Create a run, add data to it, and then view the data in the active tab of the Simulation Data Inspector.
Create Data for Run
Create two timeseries objects to contain data for a sine signal and a cosine signal. Give each timeseries object a descriptive name.
time = linspace(0,20,101);

sine_vals = sin(2*pi/5*time);
sine_ts = timeseries(sine_vals,time);
sine_ts.Name = "Sine, T=5";

cos_vals = cos(2*pi/8*time);
cos_ts = timeseries(cos_vals,time);
cos_ts.Name = "Cosine, T=8";
Create Run and Add Data
To open the Simulation Data Inspector, use Simulink.sdi.view.
Simulink.sdi.view
To import data into the Simulation Data Inspector from the workspace, create a Simulink.sdi.Run object using Simulink.sdi.Run.create. Add metadata information using the Name and Description properties of the Run object.
sinusoidsRun = Simulink.sdi.Run.create;
sinusoidsRun.Name = "Sinusoids";
sinusoidsRun.Description = "Sine and cosine signals with different frequencies";
Add the data you created in the workspace to the empty run.
add(sinusoidsRun,"vars",sine_ts,cos_ts);0.091530s wall, 0.156250s user + 0.031250s system = 0.187500s CPU (204.9%)
Plot Data in Simulation Data Inspector
To access the Simulink.sdi.Signal object corresponding to each signal, use getSignalByIndex. You can use the Simulink.sdi.Signal object properties to specify the line style and color for the signal and plot the signal in the Simulation Data Inspector. For example, specify the LineColor and LineDashed properties for each signal.
sine_sig = getSignalByIndex(sinusoidsRun,1);
sine_sig.LineColor = [0 0 1];
sine_sig.LineDashed = "-.";

cos_sig = sinusoidsRun.getSignalByIndex(2);
cos_sig.LineColor = [1 0 0];
cos_sig.LineDashed = "--";
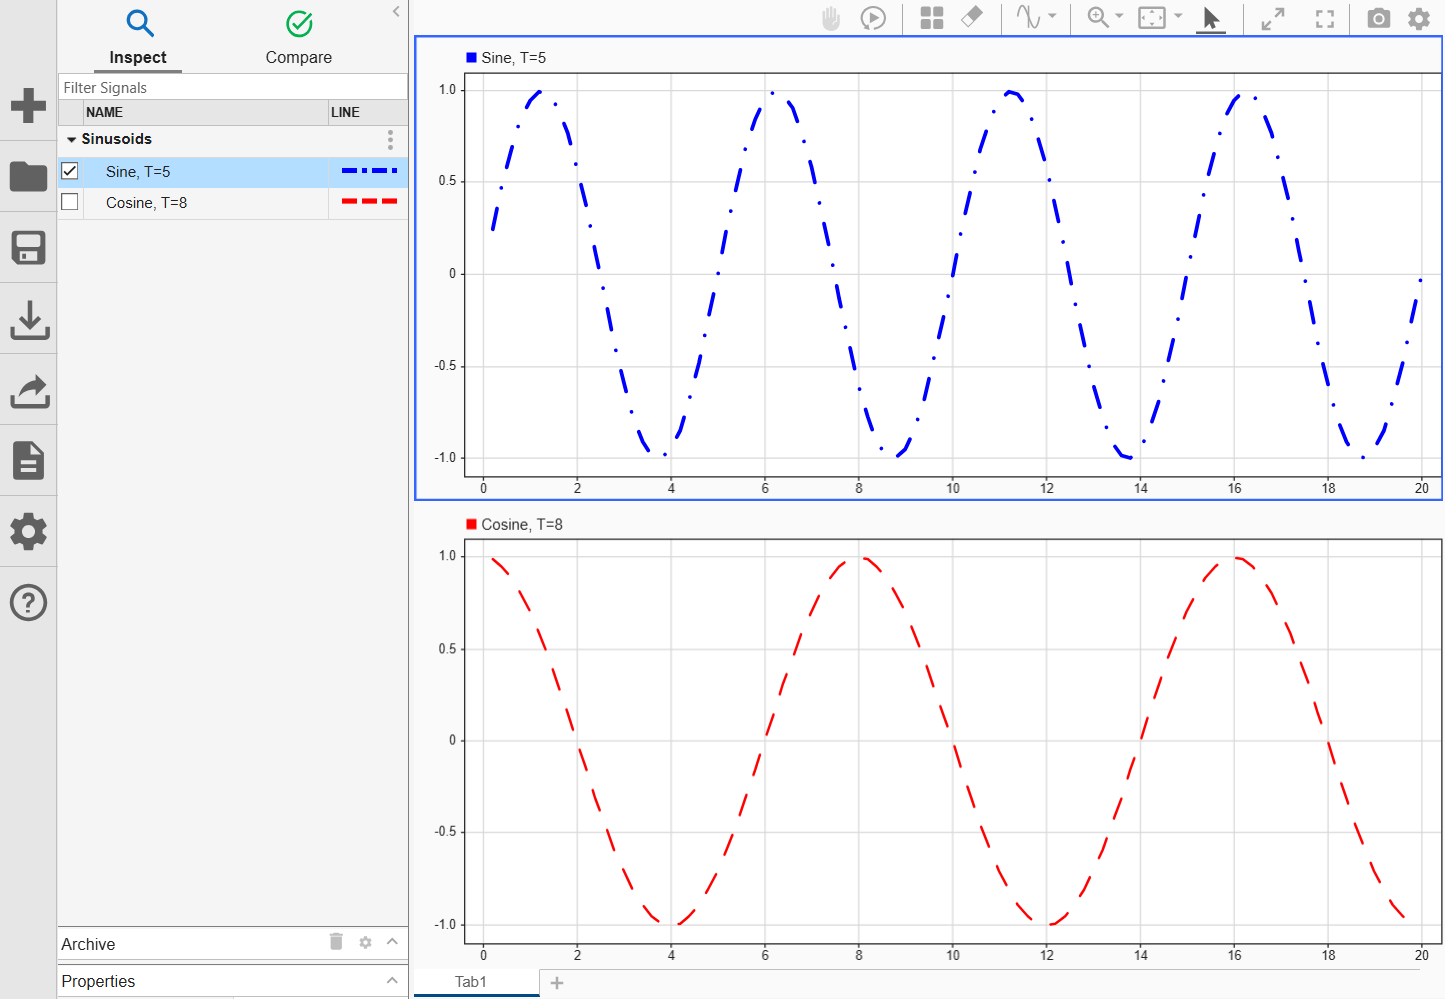
To configure a 2-by-1 subplot layout in the active tab of the Simulation Data Inspector plotting area, use Simulink.sdi.setSubPlotLayout. To plot the sine signal on the upper subplot and the cosine signal on the lower subplot, use plotOnSubPlot.
Simulink.sdi.setSubPlotLayout(2,1);

plotOnSubPlot(sine_sig,1,1,true);
plotOnSubPlot(cos_sig,2,1,true);
Inspect Data Using Cursors
To access the value of a signal at a specific time, you can add a cursor to the plot. For example, the Sine signal appears to have a local maximum at about 6 seconds. Add one cursor to the plot and observe the signal value at 6 seconds.
Simulink.sdi.setNumCursors(1)
Simulink.sdi.setCursorPositions("left",6)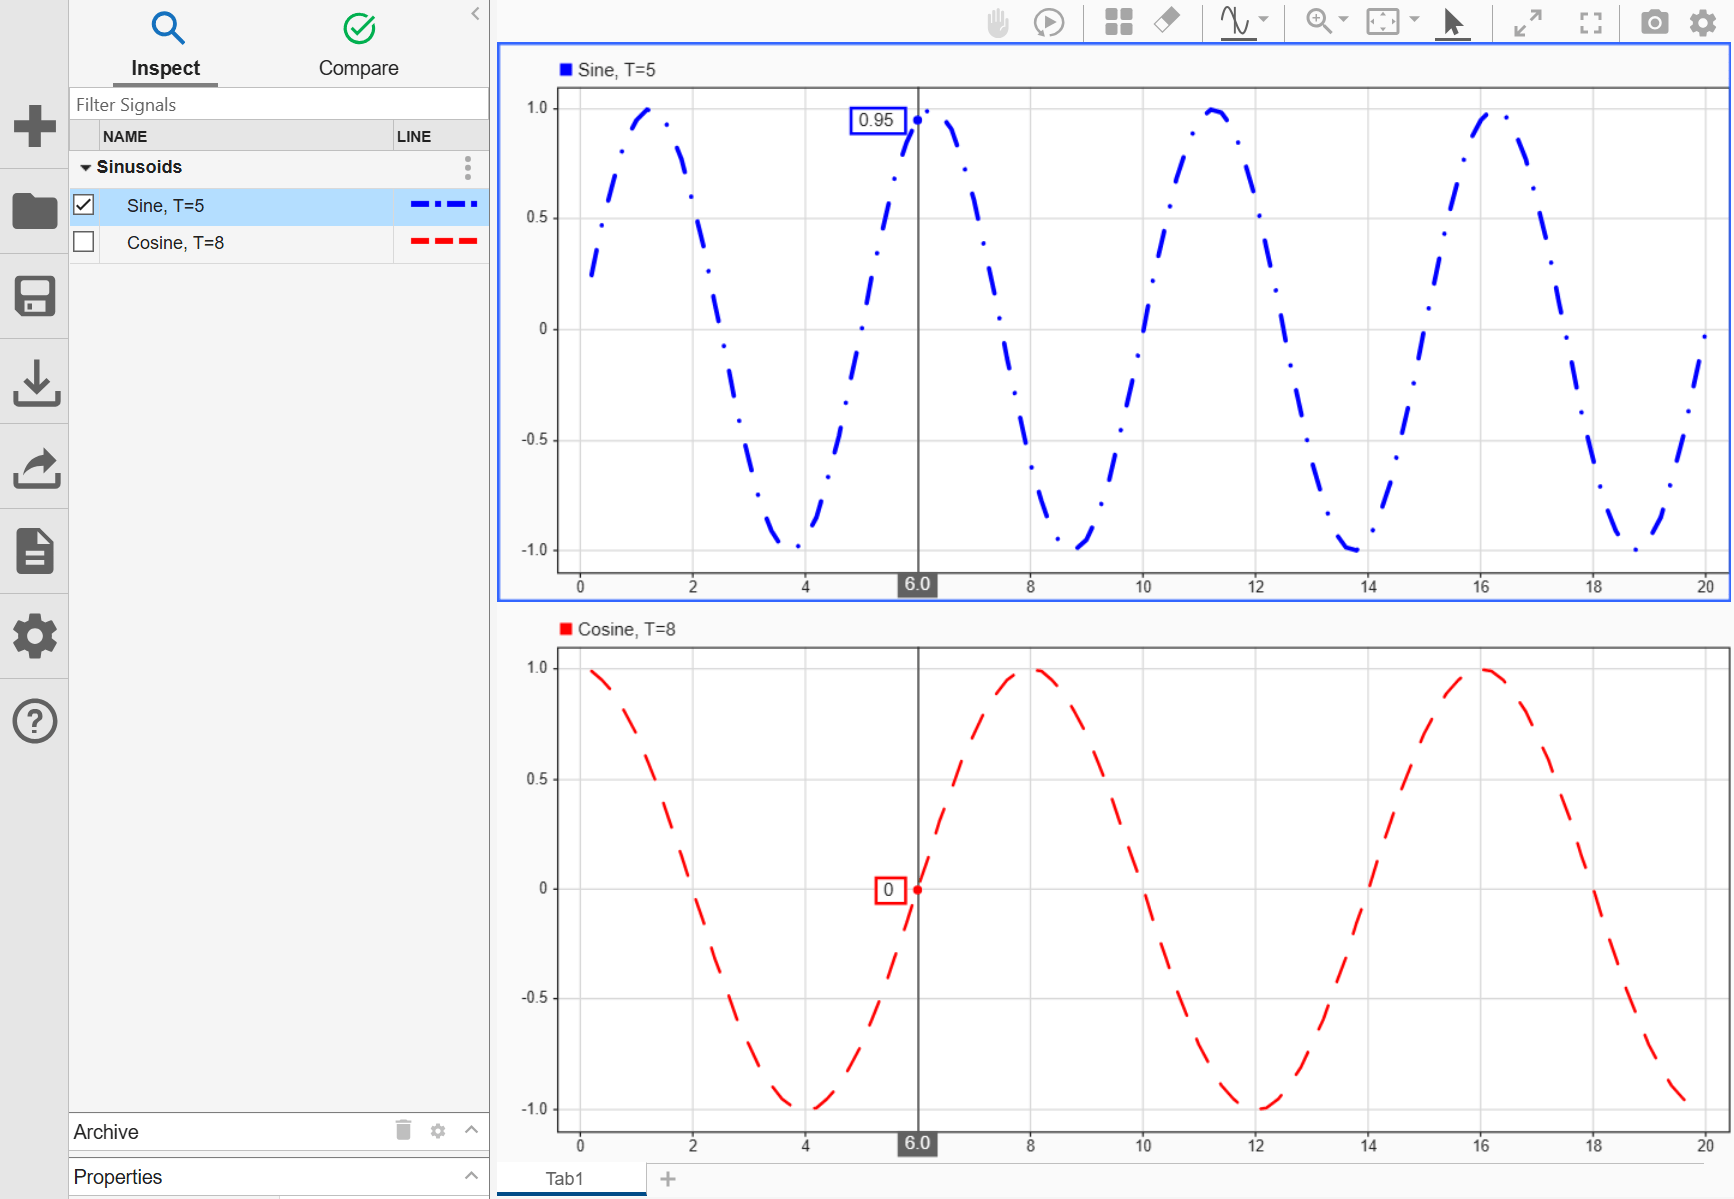
To measure the time difference between two points or extract descriptive statistics within the defined interval, add two cursors.
Simulink.sdi.setNumCursors(2)
Simulink.sdi.setCursorPositions("left",5,"right",7)
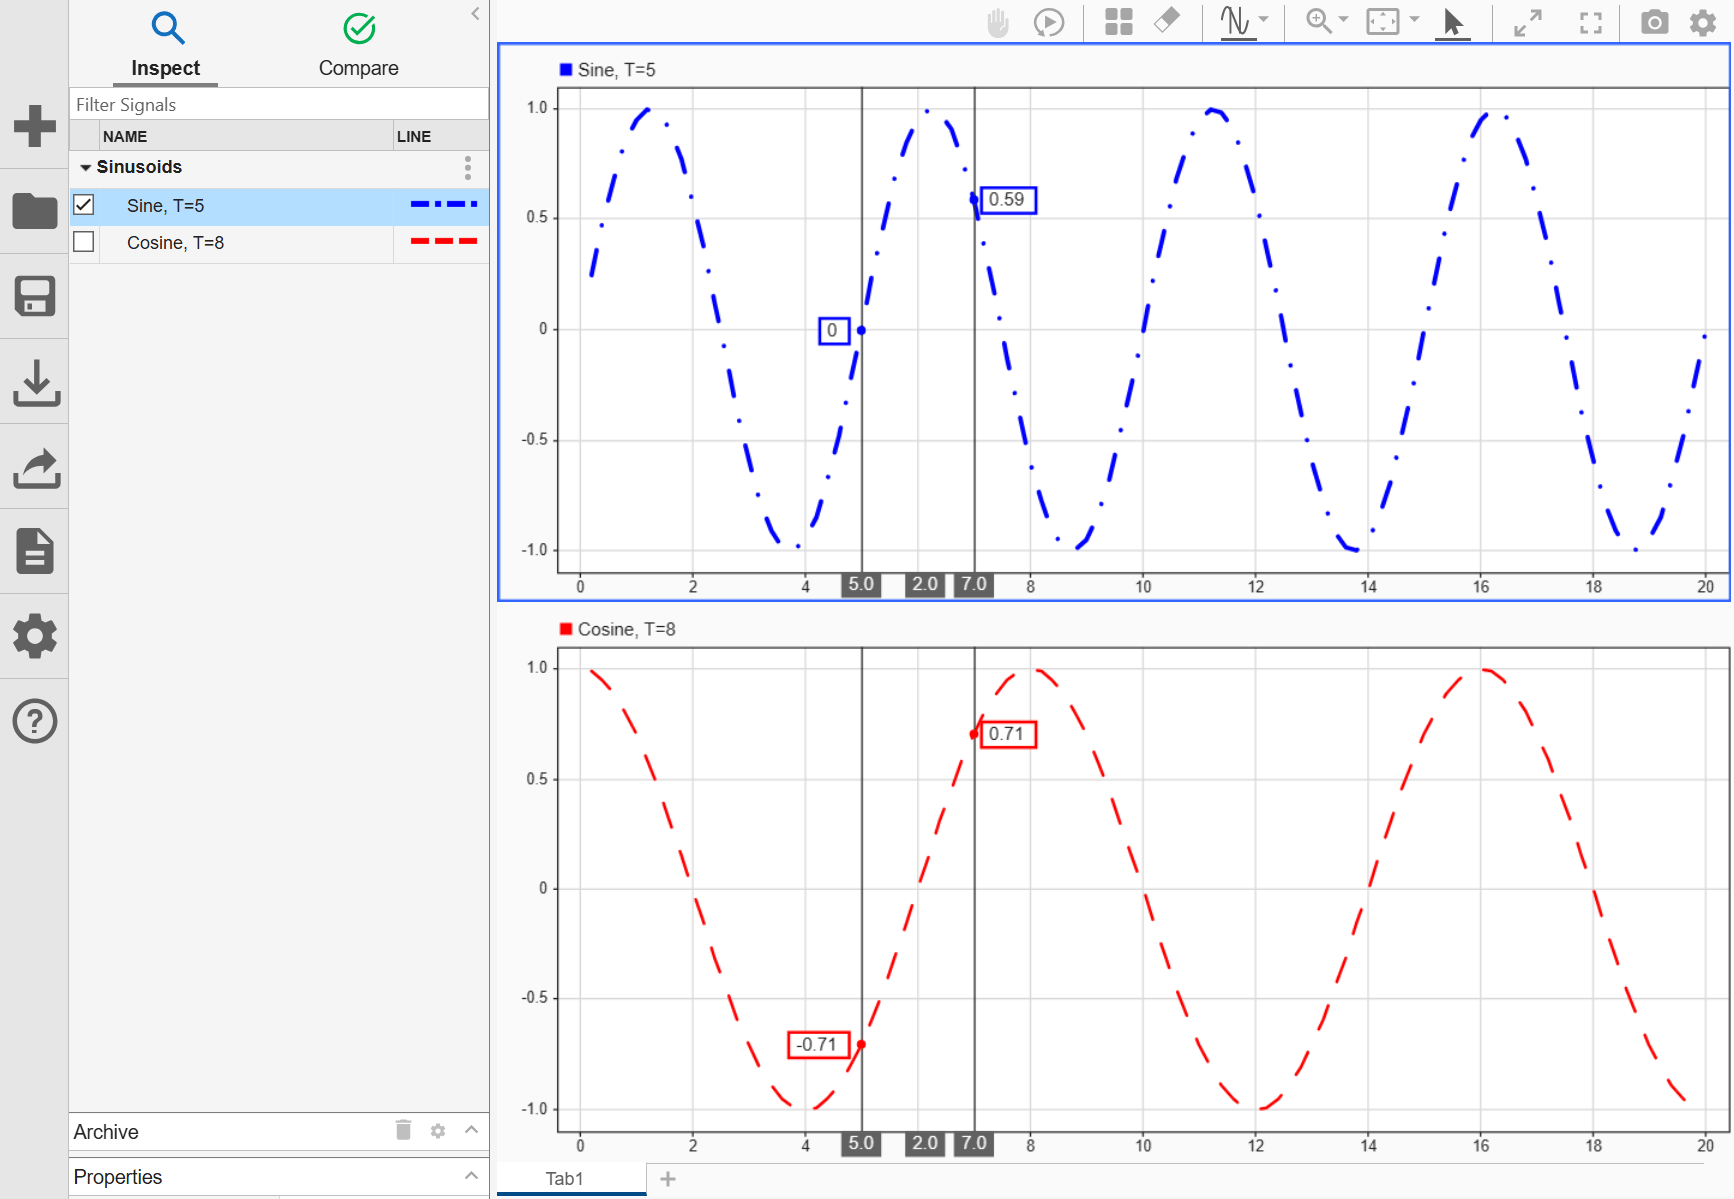
Determine the local maximum sample value in the Sine signal between the cursors using the max function.
[t1,t2] = Simulink.sdi.getCursorPositions;
localMax = max(sine_sig,t1,t2)
localMax =
0.9980
Close Simulation Data Inspector and Save Data
When you finish inspecting the plotted signal data, you can close the Simulation Data Inspector and save the session to an MLDATX file.
Simulink.sdi.close("sinusoids.mldatx")You can use the Simulation Data Inspector programmatic interface to modify a parameter for the same signal in multiple runs. This example adds an absolute tolerance of 0.1 to a signal in all four runs of data.
First, clear the workspace and load the Simulation Data Inspector session with the data. The session includes logged data from four simulations of a Simulink® model of a longitudinal controller for an aircraft.
Simulink.sdi.clear
Simulink.sdi.load('AircraftExample.mldatx');
Use the Simulink.sdi.getRunCount function to get the number of runs in the Simulation Data Inspector. You can use this number as the index for a for loop that operates on each run.
count = Simulink.sdi.getRunCount;
Then, use a for loop to assign the absolute tolerance of 0.1 to the first signal in each run.
for a = 1:count
    runID = Simulink.sdi.getRunIDByIndex(a);
    aircraftRun = Simulink.sdi.getRun(runID);
    sig = getSignalByIndex(aircraftRun,1);
    sig.AbsTol = 0.1;
end
Related Examples
Parameters
No parameters are available for this application.

