modifybins
Modify predictor’s bins
Description
sc = modifybins(sc,PredictorName,Name,Value)
Examples
Create a creditscorecard object using the CreditCardData.mat file to load the data (using a dataset from Refaat 2011).
load CreditCardData
sc = creditscorecard(data);
The predictor CustIncome is numeric. By default, each value of a predictor is placed in a separate bin.
bi = bininfo(sc,'CustIncome')bi=46×6 table
Bin Good Bad Odds WOE InfoValue
_________ ____ ___ _______ _________ __________
{'18000'} 2 3 0.66667 -1.1099 0.0056227
{'19000'} 1 2 0.5 -1.3976 0.0053002
{'20000'} 4 2 2 -0.011271 6.3641e-07
{'21000'} 6 3 2 -0.011271 9.5462e-07
{'22000'} 4 2 2 -0.011271 6.3641e-07
{'23000'} 4 4 1 -0.70442 0.0035885
{'24000'} 5 5 1 -0.70442 0.0044856
{'25000'} 4 9 0.44444 -1.5153 0.026805
{'26000'} 4 11 0.36364 -1.716 0.038999
{'27000'} 6 6 1 -0.70442 0.0053827
{'28000'} 13 11 1.1818 -0.53736 0.0061896
{'29000'} 11 10 1.1 -0.60911 0.0069988
{'30000'} 18 16 1.125 -0.58664 0.010493
{'31000'} 24 8 3 0.39419 0.0038382
{'32000'} 21 15 1.4 -0.36795 0.0042797
{'33000'} 35 19 1.8421 -0.093509 0.00039951
⋮
Use modifybins to set a minimum value of 0, and cut points every 10000, from 20000 to 60000. Display updated bin information, including cut points.
sc = modifybins(sc,'CustIncome','MinValue',0,'CutPoints',20000:10000:60000);
[bi,cp] = bininfo(sc,'CustIncome')
bi=7×6 table
           Bin           Good    Bad     Odds         WOE       InfoValue
    _________________    ____    ___    _______    _________    _________

    {'[0,20000)'    }      3       5        0.6      -1.2152     0.010765
    {'[20000,30000)'}     61      63    0.96825     -0.73668     0.060942
    {'[30000,40000)'}    324     173     1.8728    -0.076967    0.0024846
    {'[40000,50000)'}    304     123     2.4715      0.20042     0.013781
    {'[50000,60000)'}    103      32     3.2188      0.46457     0.022144
    {'[60000,Inf]'  }      8       1          8        1.375     0.010235
    {'Totals'       }    803     397     2.0227          NaN      0.12035
cp = 5×1

       20000
       30000
       40000
       50000
       60000
The first and last bins contain very few points. To merge the first bin into the second one, remove the first cut point. Similarly, to merge the last bin into the second-to-last one, remove the last cut point. Then use modifybins to update the scorecard, and display updated bin information.
cp(1)=[];
cp(end)=[];
sc = modifybins(sc,'CustIncome','CutPoints',cp);
bi = bininfo(sc,'CustIncome')
bi=5×6 table
           Bin           Good    Bad     Odds         WOE       InfoValue
    _________________    ____    ___    _______    _________    _________

    {'[0,30000)'    }     64      68    0.94118     -0.76504     0.070065
    {'[30000,40000)'}    324     173     1.8728    -0.076967    0.0024846
    {'[40000,50000)'}    304     123     2.4715      0.20042     0.013781
    {'[50000,Inf]'  }    111      33     3.3636       0.5086     0.028028
    {'Totals'       }    803     397     2.0227          NaN      0.11436
Create a creditscorecard object using the CreditCardData.mat file to load the data (using a dataset from Refaat 2011).
load CreditCardData
sc = creditscorecard(data);
The binning map or rules for categorical data are summarized in a "category grouping" table, returned as an optional output. By default, each category is placed in a separate bin. Here is the information for the predictor ResStatus.
[bi,cg] = bininfo(sc,'ResStatus')bi=4×6 table
Bin Good Bad Odds WOE InfoValue
______________ ____ ___ ______ _________ _________
{'Home Owner'} 365 177 2.0621 0.019329 0.0001682
{'Tenant' } 307 167 1.8383 -0.095564 0.0036638
{'Other' } 131 53 2.4717 0.20049 0.0059418
{'Totals' } 803 397 2.0227 NaN 0.0097738
cg=3×2 table
Category BinNumber
______________ _________
{'Home Owner'} 1
{'Tenant' } 2
{'Other' } 3
To group categories 'Tenant' and 'Other', modify the category grouping table cg, so the bin number for 'Other' is the same as the bin number for 'Tenant'. Then use modifybins to update the scorecard.
cg.BinNumber(3) = 2; sc = modifybins(sc,'ResStatus','CatGrouping',cg);
Display the updated bin information. Note that the bin labels has been updated and that the bin membership information is contained in the category grouping cg.
[bi,cg] = bininfo(sc,'ResStatus')bi=3×6 table
Bin Good Bad Odds WOE InfoValue
__________ ____ ___ ______ _________ __________
{'Group1'} 365 177 2.0621 0.019329 0.0001682
{'Group2'} 438 220 1.9909 -0.015827 0.00013772
{'Totals'} 803 397 2.0227 NaN 0.00030592
cg=3×2 table
Category BinNumber
______________ _________
{'Home Owner'} 1
{'Tenant' } 2
{'Other' } 2
Create a creditscorecard object (using a dataset from Refaat 2011).
load CreditCardData sc = creditscorecard(data,'IDVar','CustID','GoodLabel',0);
For the numerical predictor CustAge, use the modifybins function to set the following cut points:
cp = [25 37 49 65]; sc = modifybins(sc,'CustAge','CutPoints',cp,'MinValue',0,'MaxValue',75); bininfo(sc,'CustAge')
ans=6×6 table
Bin Good Bad Odds WOE InfoValue
___________ ____ ___ ______ _________ _________
{'[0,25)' } 9 8 1.125 -0.58664 0.0052464
{'[25,37)'} 125 92 1.3587 -0.39789 0.030268
{'[37,49)'} 340 183 1.8579 -0.084959 0.0031898
{'[49,65)'} 298 108 2.7593 0.31054 0.030765
{'[65,75]'} 31 6 5.1667 0.93781 0.022031
{'Totals' } 803 397 2.0227 NaN 0.0915
Use the modifybins function to merge the 2nd and 3rd bins.
sc = modifybins(sc,'CustAge','CutPoints',cp([1 3 4])); bininfo(sc,'CustAge')
ans=5×6 table
Bin Good Bad Odds WOE InfoValue
___________ ____ ___ ______ ________ _________
{'[0,25)' } 9 8 1.125 -0.58664 0.0052464
{'[25,49)'} 465 275 1.6909 -0.17915 0.020355
{'[49,65)'} 298 108 2.7593 0.31054 0.030765
{'[65,75]'} 31 6 5.1667 0.93781 0.022031
{'Totals' } 803 397 2.0227 NaN 0.078397
Display bin information for the categorical predictor ResStatus.
[bi,cg] = bininfo(sc,'ResStatus');
disp(bi) Bin Good Bad Odds WOE InfoValue
______________ ____ ___ ______ _________ _________
{'Home Owner'} 365 177 2.0621 0.019329 0.0001682
{'Tenant' } 307 167 1.8383 -0.095564 0.0036638
{'Other' } 131 53 2.4717 0.20049 0.0059418
{'Totals' } 803 397 2.0227 NaN 0.0097738
Use the modifybins function to merge categories 2 and 3.
cg.BinNumber(3) = 2; sc = modifybins(sc,'ResStatus','CatGrouping',cg); bininfo(sc,'ResStatus')
ans=3×6 table
Bin Good Bad Odds WOE InfoValue
__________ ____ ___ ______ _________ __________
{'Group1'} 365 177 2.0621 0.019329 0.0001682
{'Group2'} 438 220 1.9909 -0.015827 0.00013772
{'Totals'} 803 397 2.0227 NaN 0.00030592
Create a creditscorecard object (using a dataset from Refaat 2011).
load CreditCardData sc = creditscorecard(data,'IDVar','CustID','GoodLabel',0)
sc =
creditscorecard with properties:
GoodLabel: 0
ResponseVar: 'status'
WeightsVar: ''
VarNames: {'CustID' 'CustAge' 'TmAtAddress' 'ResStatus' 'EmpStatus' 'CustIncome' 'TmWBank' 'OtherCC' 'AMBalance' 'UtilRate' 'status'}
NumericPredictors: {'CustAge' 'TmAtAddress' 'CustIncome' 'TmWBank' 'AMBalance' 'UtilRate'}
CategoricalPredictors: {'ResStatus' 'EmpStatus' 'OtherCC'}
BinMissingData: 0
IDVar: 'CustID'
PredictorVars: {'CustAge' 'TmAtAddress' 'ResStatus' 'EmpStatus' 'CustIncome' 'TmWBank' 'OtherCC' 'AMBalance' 'UtilRate'}
Data: [1200×11 table]
For the numerical predictor TmAtAddress, use the modifybins function to set the following cut points:
cp = [30 80 120]; sc = modifybins(sc,'TmAtAddress','CutPoints',cp,'MinValue',0,'MaxValue',210); bininfo(sc,'TmAtAddress')
ans=5×6 table
Bin Good Bad Odds WOE InfoValue
_____________ ____ ___ ______ _________ __________
{'[0,30)' } 330 154 2.1429 0.057722 0.0013305
{'[30,80)' } 379 201 1.8856 -0.070187 0.0024086
{'[80,120)' } 78 36 2.1667 0.068771 0.00044396
{'[120,210]'} 16 6 2.6667 0.27641 0.0013301
{'Totals' } 803 397 2.0227 NaN 0.0055131
Use the modifybins function to split the 2nd bin.
sc = modifybins(sc,'TmAtAddress','CutPoints',[cp(1) 50 cp(2:end)]); bininfo(sc,'TmAtAddress')
ans=6×6 table
Bin Good Bad Odds WOE InfoValue
_____________ ____ ___ ______ _________ __________
{'[0,30)' } 330 154 2.1429 0.057722 0.0013305
{'[30,50)' } 211 104 2.0288 0.0030488 2.4387e-06
{'[50,80)' } 168 97 1.732 -0.15517 0.005449
{'[80,120)' } 78 36 2.1667 0.068771 0.00044396
{'[120,210]'} 16 6 2.6667 0.27641 0.0013301
{'Totals' } 803 397 2.0227 NaN 0.0085559
Display bin information for the categorical predictor ResStatus.
[bi,cg] = bininfo(sc,'ResStatus')bi=4×6 table
Bin Good Bad Odds WOE InfoValue
______________ ____ ___ ______ _________ _________
{'Home Owner'} 365 177 2.0621 0.019329 0.0001682
{'Tenant' } 307 167 1.8383 -0.095564 0.0036638
{'Other' } 131 53 2.4717 0.20049 0.0059418
{'Totals' } 803 397 2.0227 NaN 0.0097738
cg=3×2 table
Category BinNumber
______________ _________
{'Home Owner'} 1
{'Tenant' } 2
{'Other' } 3
Use the modifybins function to merge categories 2 and 3.
cg.BinNumber(3) = 2; sc = modifybins(sc,'ResStatus','CatGrouping',cg); bininfo(sc,'ResStatus')
ans=3×6 table
Bin Good Bad Odds WOE InfoValue
__________ ____ ___ ______ _________ __________
{'Group1'} 365 177 2.0621 0.019329 0.0001682
{'Group2'} 438 220 1.9909 -0.015827 0.00013772
{'Totals'} 803 397 2.0227 NaN 0.00030592
Use the modifybins function to split bin 2 and put Other under bin 3.
cg.BinNumber(3) = 3; sc = modifybins(sc,'ResStatus','CatGrouping',cg); [bi,cg] = bininfo(sc,'ResStatus')
bi=4×6 table
         Bin          Good    Bad     Odds        WOE       InfoValue
    ______________    ____    ___    ______    _________    _________

    {'Home Owner'}    365     177    2.0621     0.019329    0.0001682
    {'Tenant'    }    307     167    1.8383    -0.095564    0.0036638
    {'Other'     }    131      53    2.4717      0.20049    0.0059418
    {'Totals'    }    803     397    2.0227          NaN    0.0097738
cg=3×2 table
       Category       BinNumber
    ______________    _________

    {'Home Owner'}        1
    {'Tenant'    }        2
    {'Other'     }        3
Create a creditscorecard object using the CreditCardData.mat file to load the data (using a dataset from Refaat 2011).
load CreditCardData
sc = creditscorecard(data);Use modifybins to reset the minimum value and create three bins for the predictor CustIncome and display updated bin information.
sc = modifybins(sc,'CustIncome','MinValue',0,'CutPoints',[30000 50000]); bi = bininfo(sc,'CustIncome')
bi=4×6 table
Bin Good Bad Odds WOE InfoValue
_________________ ____ ___ _______ ________ _________
{'[0,30000)' } 64 68 0.94118 -0.76504 0.070065
{'[30000,50000)'} 628 296 2.1216 0.047762 0.0017421
{'[50000,Inf]' } 111 33 3.3636 0.5086 0.028028
{'Totals' } 803 397 2.0227 NaN 0.099836
Modify the bin labels and display updated bin information.
NewLabels = {'Up to 30k','30k to 50k','50k and more'};
sc = modifybins(sc,'CustIncome','BinLabels',NewLabels);
bi = bininfo(sc,'CustIncome')bi=4×6 table
Bin Good Bad Odds WOE InfoValue
________________ ____ ___ _______ ________ _________
{'Up to 30k' } 64 68 0.94118 -0.76504 0.070065
{'30k to 50k' } 628 296 2.1216 0.047762 0.0017421
{'50k and more'} 111 33 3.3636 0.5086 0.028028
{'Totals' } 803 397 2.0227 NaN 0.099836
Bin labels should be the last bin-modification step. As in this example, user-defined bin labels often contain information about the cut points, minimum, or maximum values for numeric data, or information about category groupings for categorical data. To prevent situations where user-defined labels and cut points are inconsistent (and labels are misleading), the creditscorecard object overrides user-defined labels every time the bins are modified using modifybins.
To illustrate modifybins overriding user-defined labels every time the bins are modified, reset the first cut point to 31000 and display updated bin information. Note that the bin labels are reset to their default format and accurately reflect the change in the cut points.
sc = modifybins(sc,'CustIncome','CutPoints',[31000 50000]); bi = bininfo(sc,'CustIncome')
bi=4×6 table
Bin Good Bad Odds WOE InfoValue
_________________ ____ ___ _______ ________ _________
{'[0,31000)' } 82 84 0.97619 -0.72852 0.079751
{'[31000,50000)'} 610 280 2.1786 0.074251 0.0040364
{'[50000,Inf]' } 111 33 3.3636 0.5086 0.028028
{'Totals' } 803 397 2.0227 NaN 0.11182
Create a creditscorecard object using the CreditCardData.mat file to load the dataMissing with missing values.
load CreditCardData.mat
head(dataMissing,5) CustID CustAge TmAtAddress ResStatus EmpStatus CustIncome TmWBank OtherCC AMBalance UtilRate status
______ _______ ___________ ___________ _________ __________ _______ _______ _________ ________ ______
1 53 62 <undefined> Unknown 50000 55 Yes 1055.9 0.22 0
2 61 22 Home Owner Employed 52000 25 Yes 1161.6 0.24 0
3 47 30 Tenant Employed 37000 61 No 877.23 0.29 0
4 NaN 75 Home Owner Employed 53000 20 Yes 157.37 0.08 0
5 68 56 Home Owner Employed 53000 14 Yes 561.84 0.11 0
fprintf('Number of rows: %d\n',height(dataMissing))Number of rows: 1200
fprintf('Number of missing values CustAge: %d\n',sum(ismissing(dataMissing.CustAge)))Number of missing values CustAge: 30
fprintf('Number of missing values ResStatus: %d\n',sum(ismissing(dataMissing.ResStatus)))Number of missing values ResStatus: 40
Use creditscorecard with the name-value argument 'BinMissingData' set to true to bin the missing data in a separate bin.
sc = creditscorecard(dataMissing,'IDVar','CustID','BinMissingData',true); sc = autobinning(sc); disp(sc)
creditscorecard with properties:
GoodLabel: 0
ResponseVar: 'status'
WeightsVar: ''
VarNames: {'CustID' 'CustAge' 'TmAtAddress' 'ResStatus' 'EmpStatus' 'CustIncome' 'TmWBank' 'OtherCC' 'AMBalance' 'UtilRate' 'status'}
NumericPredictors: {'CustAge' 'TmAtAddress' 'CustIncome' 'TmWBank' 'AMBalance' 'UtilRate'}
CategoricalPredictors: {'ResStatus' 'EmpStatus' 'OtherCC'}
BinMissingData: 1
IDVar: 'CustID'
PredictorVars: {'CustAge' 'TmAtAddress' 'ResStatus' 'EmpStatus' 'CustIncome' 'TmWBank' 'OtherCC' 'AMBalance' 'UtilRate'}
Data: [1200×11 table]
Display bin information for numeric data for 'CustAge' that includes missing data in a separate bin labelled <missing>.
[bi,cp] = bininfo(sc,'CustAge');
disp(bi) Bin Good Bad Odds WOE InfoValue
_____________ ____ ___ ______ ________ __________
{'[-Inf,33)'} 69 52 1.3269 -0.42156 0.018993
{'[33,37)' } 63 45 1.4 -0.36795 0.012839
{'[37,40)' } 72 47 1.5319 -0.2779 0.0079824
{'[40,46)' } 172 89 1.9326 -0.04556 0.0004549
{'[46,48)' } 59 25 2.36 0.15424 0.0016199
{'[48,51)' } 99 41 2.4146 0.17713 0.0035449
{'[51,58)' } 157 62 2.5323 0.22469 0.0088407
{'[58,Inf]' } 93 25 3.72 0.60931 0.032198
{'<missing>'} 19 11 1.7273 -0.15787 0.00063885
{'Totals' } 803 397 2.0227 NaN 0.087112
plotbins(sc,'CustAge')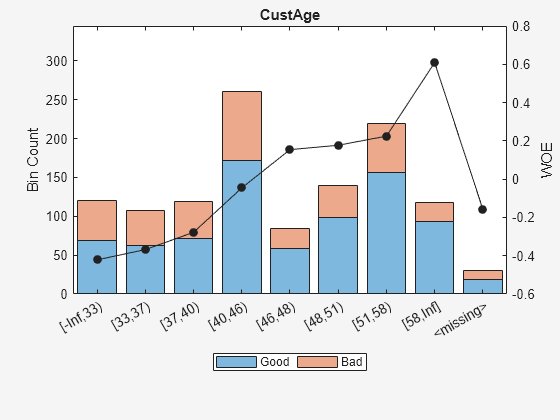
For the numeric predictor CustAge, remove cut points 48 and 51 and then use modifybins to define a 'MinValue'of 0 to manually change the binning and notice that this does not affect the data in the <missing> bin and the <missing> bin remains at the end.
cp(cp==48) = []; cp(cp==51) = []; sc = modifybins(sc,'CustAge','CutPoints',cp,'MinValue',0); bi = bininfo(sc,'CustAge'); disp(bi)
Bin Good Bad Odds WOE InfoValue
_____________ ____ ___ ______ ________ __________
{'[0,33)' } 69 52 1.3269 -0.42156 0.018993
{'[33,37)' } 63 45 1.4 -0.36795 0.012839
{'[37,40)' } 72 47 1.5319 -0.2779 0.0079824
{'[40,46)' } 172 89 1.9326 -0.04556 0.0004549
{'[46,58)' } 315 128 2.4609 0.19612 0.013701
{'[58,Inf]' } 93 25 3.72 0.60931 0.032198
{'<missing>'} 19 11 1.7273 -0.15787 0.00063885
{'Totals' } 803 397 2.0227 NaN 0.086808
plotbins(sc,'CustAge')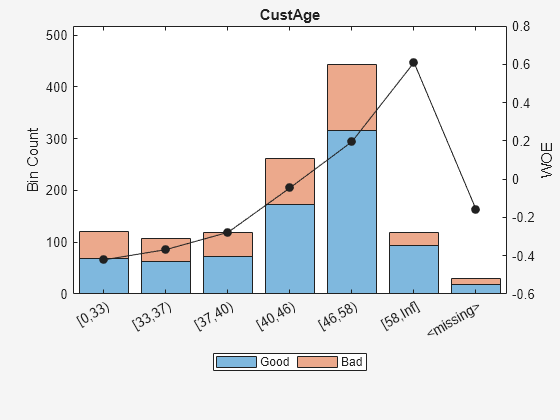
Display bin information for categorical data for 'ResStatus' that includes missing data in a separate bin labelled <missing>.
[bi,cg] = bininfo(sc,'ResStatus');
disp(bi) Bin Good Bad Odds WOE InfoValue
______________ ____ ___ ______ _________ __________
{'Tenant' } 296 161 1.8385 -0.095463 0.0035249
{'Home Owner'} 352 171 2.0585 0.017549 0.00013382
{'Other' } 128 52 2.4615 0.19637 0.0055808
{'<missing>' } 27 13 2.0769 0.026469 2.3248e-05
{'Totals' } 803 397 2.0227 NaN 0.0092627
plotbins(sc,'ResStatus')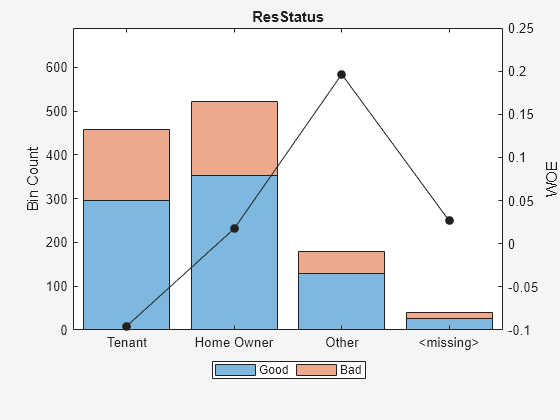
For the categorical predictor ResStatus, use modifybins to manually merge 'HomeOwner' and 'Other' into a single group by assigning the same bin number to these categories. Notice that this does not affect the data in the <missing> bin and the <missing> bin remains at the end.
cg.BinNumber(3) = 2; sc = modifybins(sc,'ResStatus','CatGrouping',cg); [bi,cg] = bininfo(sc,'ResStatus'); disp(bi)
         Bin         Good    Bad     Odds        WOE       InfoValue
    _____________    ____    ___    ______    _________    __________

    {'Group1'   }    296     161    1.8385    -0.095463     0.0035249
    {'Group2'   }    480     223    2.1525     0.062196     0.0022419
    {'<missing>'}     27      13    2.0769     0.026469    2.3248e-05
    {'Totals'   }    803     397    2.0227          NaN       0.00579
disp(cg)
       Category       BinNumber
    ______________    _________

    {'Tenant'    }        1
    {'Home Owner'}        2
    {'Other'     }        2
Input Arguments
Name-Value Arguments
Output Arguments
References
[1] Anderson, R. The Credit Scoring Toolkit. Oxford University Press, 2007.
[2] Refaat, M. Credit Risk Scorecards: Development and Implementation Using SAS. lulu.com, 2011.
Version History
Introduced in R2014b
See Also
creditscorecard | autobinning | bininfo | predictorinfo | modifypredictor | bindata | plotbins | fitmodel | displaypoints | formatpoints | score | setmodel | probdefault | validatemodel