plotbins
Plot histogram counts for predictor variables
Syntax
Description
plotbins(
plots histogram counts for given predictor variables. When a predictor’s bins
are modified using sc,PredictorName)modifybins or autobinning, rerun
plotbins to update the figure to reflect the change.
hFigure = plotbins(sc,PredictorName)plotbins plots histogram
counts for given predictor variables. When a predictor’s bins are modified using
modifybins or autobinning, rerun
plotbins to update the figure to reflect the
change.
hFigure = plotbins(___,Name,Value)plotbins plots histogram
counts for given predictor variables using optional name-value pair arguments.
When a predictor’s bins are modified using modifybins or autobinning, rerun
plotbins to update the figure to reflect the
change.
Examples
Create a creditscorecard object using the CreditCardData.mat file to load the data (using a dataset from Refaat 2011).
load CreditCardData
sc = creditscorecard(data);
Perform automatic binning for the PredictorName input argument for CustIncome using the defaults for the algorithm Monotone.
sc = autobinning(sc, 'CustIncome')sc =
creditscorecard with properties:
GoodLabel: 0
ResponseVar: 'status'
WeightsVar: ''
VarNames: {'CustID' 'CustAge' 'TmAtAddress' 'ResStatus' 'EmpStatus' 'CustIncome' 'TmWBank' 'OtherCC' 'AMBalance' 'UtilRate' 'status'}
NumericPredictors: {'CustID' 'CustAge' 'TmAtAddress' 'CustIncome' 'TmWBank' 'AMBalance' 'UtilRate'}
CategoricalPredictors: {'ResStatus' 'EmpStatus' 'OtherCC'}
BinMissingData: 0
IDVar: ''
PredictorVars: {'CustID' 'CustAge' 'TmAtAddress' 'ResStatus' 'EmpStatus' 'CustIncome' 'TmWBank' 'OtherCC' 'AMBalance' 'UtilRate'}
Data: [1200×11 table]
Use bininfo to display the autobinned data.
[bi, cp] = bininfo(sc, 'CustIncome')bi=8×6 table
Bin Good Bad Odds WOE InfoValue
_________________ ____ ___ _______ _________ __________
{'[-Inf,29000)' } 53 58 0.91379 -0.79457 0.06364
{'[29000,33000)'} 74 49 1.5102 -0.29217 0.0091366
{'[33000,35000)'} 68 36 1.8889 -0.06843 0.00041042
{'[35000,40000)'} 193 98 1.9694 -0.026696 0.00017359
{'[40000,42000)'} 68 34 2 -0.011271 1.0819e-05
{'[42000,47000)'} 164 66 2.4848 0.20579 0.0078175
{'[47000,Inf]' } 183 56 3.2679 0.47972 0.041657
{'Totals' } 803 397 2.0227 NaN 0.12285
cp = 6×1

       29000
       33000
       35000
       40000
       42000
       47000
Manually remove the second cut point (the boundary between the second and third bins) to merge bins two and three. Use the modifybins function to update the scorecard and then display updated bin information.
cp(2) = [];
sc = modifybins(sc,'CustIncome','CutPoints',cp);
bi = bininfo(sc,'CustIncome')
bi=7×6 table
           Bin           Good    Bad     Odds         WOE       InfoValue
    _________________    ____    ___    _______    _________    __________

    {'[-Inf,29000)' }     53      58    0.91379     -0.79457       0.06364
    {'[29000,35000)'}    142      85     1.6706     -0.19124     0.0071274
    {'[35000,40000)'}    193      98     1.9694    -0.026696    0.00017359
    {'[40000,42000)'}     68      34          2    -0.011271    1.0819e-05
    {'[42000,47000)'}    164      66     2.4848      0.20579     0.0078175
    {'[47000,Inf]'  }    183      56     3.2679      0.47972      0.041657
    {'Totals'       }    803     397     2.0227          NaN       0.12043
Plot the histogram count for updated bin information for the PredictorName called CustIncome.
plotbins(sc,'CustIncome')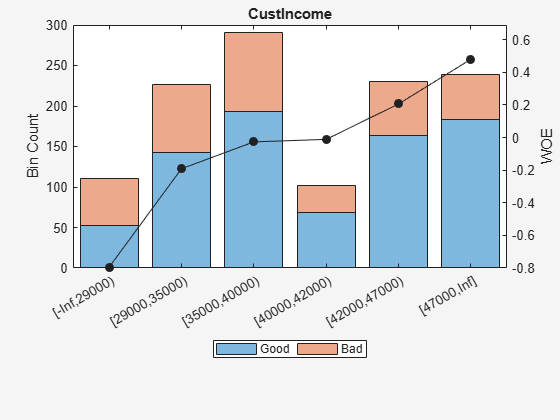
Create a creditscorecard object using the CreditCardData.mat file to load the data (using a dataset from Refaat 2011).
load CreditCardData
sc = creditscorecard(data);
Perform automatic binning for the PredictorName input argument for CustIncome using the defaults for the algorithm Monotone.
sc = autobinning(sc, 'CustIncome')sc =
creditscorecard with properties:
GoodLabel: 0
ResponseVar: 'status'
WeightsVar: ''
VarNames: {'CustID' 'CustAge' 'TmAtAddress' 'ResStatus' 'EmpStatus' 'CustIncome' 'TmWBank' 'OtherCC' 'AMBalance' 'UtilRate' 'status'}
NumericPredictors: {'CustID' 'CustAge' 'TmAtAddress' 'CustIncome' 'TmWBank' 'AMBalance' 'UtilRate'}
CategoricalPredictors: {'ResStatus' 'EmpStatus' 'OtherCC'}
BinMissingData: 0
IDVar: ''
PredictorVars: {'CustID' 'CustAge' 'TmAtAddress' 'ResStatus' 'EmpStatus' 'CustIncome' 'TmWBank' 'OtherCC' 'AMBalance' 'UtilRate'}
Data: [1200×11 table]
Use bininfo to display the autobinned data.
[bi, cp] = bininfo(sc, 'CustIncome')bi=8×6 table
Bin Good Bad Odds WOE InfoValue
_________________ ____ ___ _______ _________ __________
{'[-Inf,29000)' } 53 58 0.91379 -0.79457 0.06364
{'[29000,33000)'} 74 49 1.5102 -0.29217 0.0091366
{'[33000,35000)'} 68 36 1.8889 -0.06843 0.00041042
{'[35000,40000)'} 193 98 1.9694 -0.026696 0.00017359
{'[40000,42000)'} 68 34 2 -0.011271 1.0819e-05
{'[42000,47000)'} 164 66 2.4848 0.20579 0.0078175
{'[47000,Inf]' } 183 56 3.2679 0.47972 0.041657
{'Totals' } 803 397 2.0227 NaN 0.12285
cp = 6×1

       29000
       33000
       35000
       40000
       42000
       47000
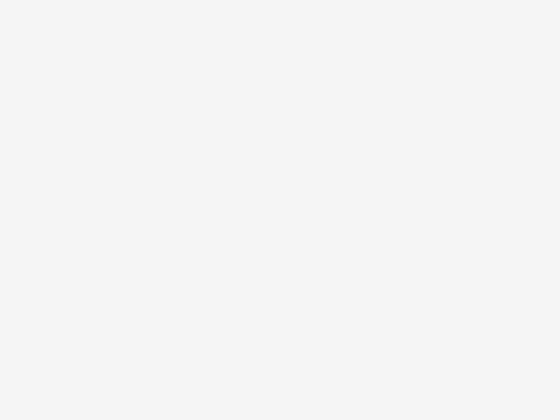
Plot the bin information for CustIncome without the Weight of Evidence (WOE) line and without a legend by setting the 'WOE' and 'Legend' name-value arguments to 'Off'. Also, set the 'BinText' name-value pair argument to 'PercentRows' to show as text over the plot bars for the proportion of "Good" and "Bad" within each bin, that is, the probability of "Good" and "Bad" within each bin.
plotbins(sc,'CustIncome','WOE','Off','Legend','Off','BinText','PercentRows')
Create a creditscorecard object using the CreditCardData.mat file to load the data with missing values.
load CreditCardData.mat
head(dataMissing,5)
CustID CustAge TmAtAddress ResStatus EmpStatus CustIncome TmWBank OtherCC AMBalance UtilRate status
______ _______ ___________ ___________ _________ __________ _______ _______ _________ ________ ______
1 53 62 <undefined> Unknown 50000 55 Yes 1055.9 0.22 0
2 61 22 Home Owner Employed 52000 25 Yes 1161.6 0.24 0
3 47 30 Tenant Employed 37000 61 No 877.23 0.29 0
4 NaN 75 Home Owner Employed 53000 20 Yes 157.37 0.08 0
5 68 56 Home Owner Employed 53000 14 Yes 561.84 0.11 0
fprintf('Number of rows: %d\n',height(dataMissing))Number of rows: 1200
fprintf('Number of missing values CustAge: %d\n',sum(ismissing(dataMissing.CustAge)))Number of missing values CustAge: 30
fprintf('Number of missing values ResStatus: %d\n',sum(ismissing(dataMissing.ResStatus)))Number of missing values ResStatus: 40
Use creditscorecard with the name-value argument 'BinMissingData' set to true to bin the missing numeric or categorical data in a separate bin.
sc = creditscorecard(dataMissing,'IDVar','CustID','BinMissingData',true);
sc = autobinning(sc);

disp(sc)
  creditscorecard with properties:

                GoodLabel: 0
              ResponseVar: 'status'
               WeightsVar: ''
                 VarNames: {'CustID'  'CustAge'  'TmAtAddress'  'ResStatus'  'EmpStatus'  'CustIncome'  'TmWBank'  'OtherCC'  'AMBalance'  'UtilRate'  'status'}
        NumericPredictors: {'CustAge'  'TmAtAddress'  'CustIncome'  'TmWBank'  'AMBalance'  'UtilRate'}
    CategoricalPredictors: {'ResStatus'  'EmpStatus'  'OtherCC'}
           BinMissingData: 1
                    IDVar: 'CustID'
            PredictorVars: {'CustAge'  'TmAtAddress'  'ResStatus'  'EmpStatus'  'CustIncome'  'TmWBank'  'OtherCC'  'AMBalance'  'UtilRate'}
                     Data: [1200×11 table]
Display and plot bin information for numeric data for 'CustAge' that includes missing data in a separate bin labelled <missing>.
[bi,cp] = bininfo(sc,'CustAge');
disp(bi)
Bin Good Bad Odds WOE InfoValue
_____________ ____ ___ ______ ________ __________
{'[-Inf,33)'} 69 52 1.3269 -0.42156 0.018993
{'[33,37)' } 63 45 1.4 -0.36795 0.012839
{'[37,40)' } 72 47 1.5319 -0.2779 0.0079824
{'[40,46)' } 172 89 1.9326 -0.04556 0.0004549
{'[46,48)' } 59 25 2.36 0.15424 0.0016199
{'[48,51)' } 99 41 2.4146 0.17713 0.0035449
{'[51,58)' } 157 62 2.5323 0.22469 0.0088407
{'[58,Inf]' } 93 25 3.72 0.60931 0.032198
{'<missing>'} 19 11 1.7273 -0.15787 0.00063885
{'Totals' } 803 397 2.0227 NaN 0.087112
plotbins(sc,'CustAge')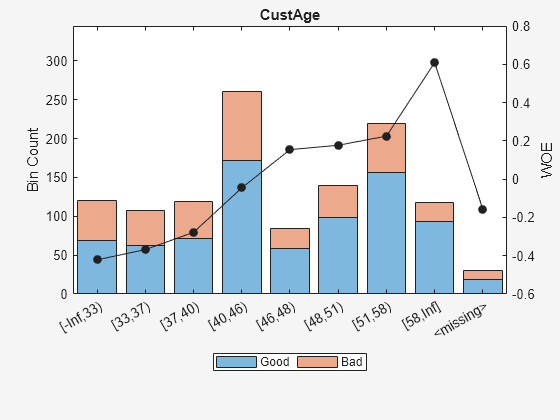
Display and plot bin information for categorical data for 'ResStatus' that includes missing data in a separate bin labelled <missing>.
[bi,cg] = bininfo(sc,'ResStatus');
disp(bi)
Bin Good Bad Odds WOE InfoValue
______________ ____ ___ ______ _________ __________
{'Tenant' } 296 161 1.8385 -0.095463 0.0035249
{'Home Owner'} 352 171 2.0585 0.017549 0.00013382
{'Other' } 128 52 2.4615 0.19637 0.0055808
{'<missing>' } 27 13 2.0769 0.026469 2.3248e-05
{'Totals' } 803 397 2.0227 NaN 0.0092627
plotbins(sc,'ResStatus')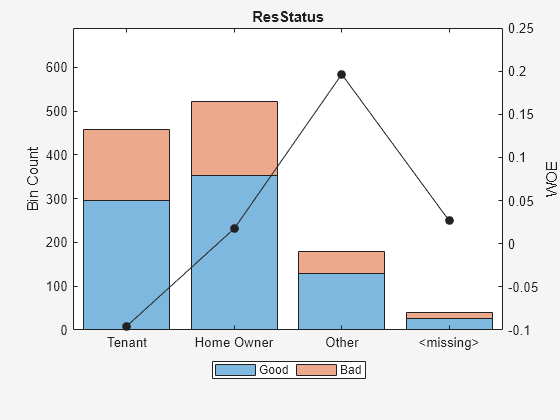
Input Arguments
Name-Value Arguments
Output Arguments
References
[1] Anderson, R. The Credit Scoring Toolkit. Oxford University Press, 2007.
[2] Refaat, M. Credit Risk Scorecards: Development and Implementation Using SAS. lulu.com, 2011.
Version History
Introduced in R2014b
See Also
creditscorecard | autobinning | bininfo | predictorinfo | modifypredictor | bindata | modifybins | fitmodel | displaypoints | formatpoints | score | setmodel | probdefault | validatemodel