uidraw
Description
The uidraw function enables you to interactively draw ROI
annotations in a Viewer object, which includes images displayed using the
imageshow
function and volumes displayed using volshow. You can
specify the initial appearance of the ROI by using name-value arguments. After you create the
ROI, you can use object properties to further customize the ROI annotation.
roi = uidraw(viewer,shape,Name=Value)Position
argument to place one or multiple ROIs in the viewer programmatically, without needing to
draw them manually.
Examples
Read an image into the workspace and display it.
viewer = viewer2d;
I = imageshow("coins.png",Parent=viewer);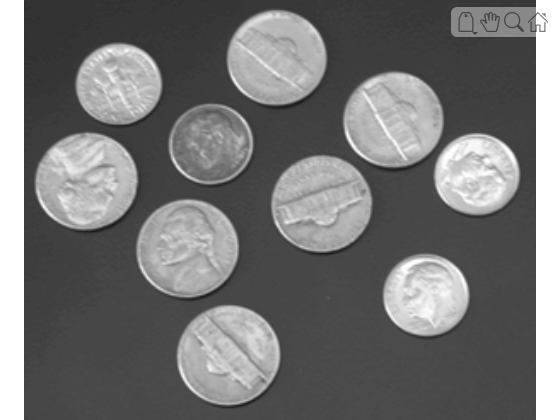
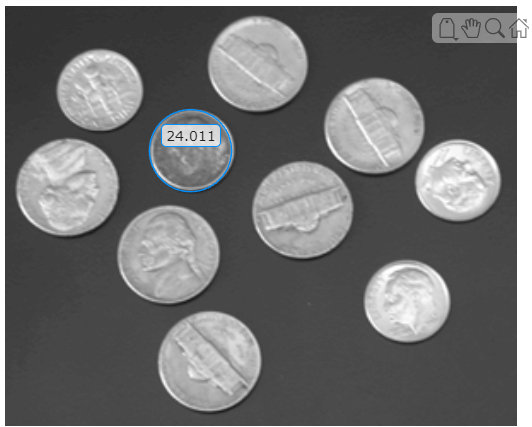
Enable the interactive drawing tool for a circular ROI in the viewer window. Specify the viewer as the parent of the image object returned by imageshow. The function returns a Circle object.
d = uidraw(viewer,"circle");To draw the circle ROI, click a point on the circumference of the circle, drag to the opposite point on the circumference, and release to finish drawing. The label displays the radius of the circle, in pixels. To resize the circle, drag a point on the circumference. To translate the circle without resizing, hold Ctrl while you drag a point on the circumference.
This screenshot shows the display after interactively drawing a circle to label one dime.
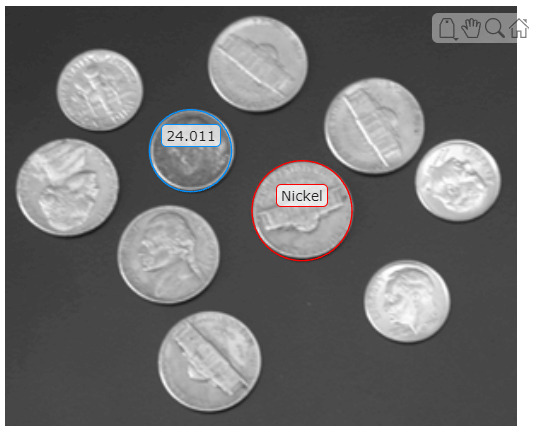
You can customize the appearance and behavior of the circle before you draw it by specifying name-value arguments. For example, specify a custom color and label, and then draw a circle around a nickel in the image.
n = uidraw(viewer,"circle",Color="red",Label="Nickel");
This screenshot shows the display after drawing the second circle.
Create a viewer and display an image in it.
viewer = viewer2d;
imageshow("peppers.png",Parent=viewer)
Enable the interactive drawing tool for a rectangular ROI in the viewer window. Specify the Label name-value argument as "" to display the rectangle without a label. To draw the rectangle, click and hold on the image to place a vertex, drag to draw the rectangle, and release to place the opposite vertex. The rectangle displays without a label.
roi = uidraw(viewer,"rectangle",Label="");

Load a 3-D MRI image volume, vol, with 1-by-1-by-1 mm voxel spacing into the workspace. The MRI data is a modified subset of the BraTS data set [1].
dataDir = fullfile(toolboxdir("images"),"imdata","BrainMRILabeled");
load(fullfile(dataDir,"images","vol_001.mat"))
Create a viewer to display the volume. By default, ROI annotations display in voxel units with no label. To display a units label, specify the SpatialUnits property of the viewer.
viewer = viewer3d;
viewer.SpatialUnits = "mm";
Display the volume in the viewer as 2-D slice planes. Note that specifying the SpatialUnits property only changes the label units. If your volume has voxel spacing other than 1-by-1-by-1 mm, you must specify the Transformation argument of volshow to display the volume correctly and generate accurate measurements.
Volume = volshow(vol,Parent=viewer, ...
    RenderingStyle="SlicePlanes");
Add a line annotation to measure the tumor size using the uidraw function. To draw the line, first rotate the volume to view the transverse plane by clicking the Z axis indicator in the lower-left corner of the viewer. To facilitate accurate measurement, zoom in on the region containing the tumor. Click and hold the slice to place the first endpoint, drag to draw the line, and release to place the second endpoint.
line = uidraw(viewer,"line");Zoom in to focus on the tumor region.
viewer.CameraZoom = 3;
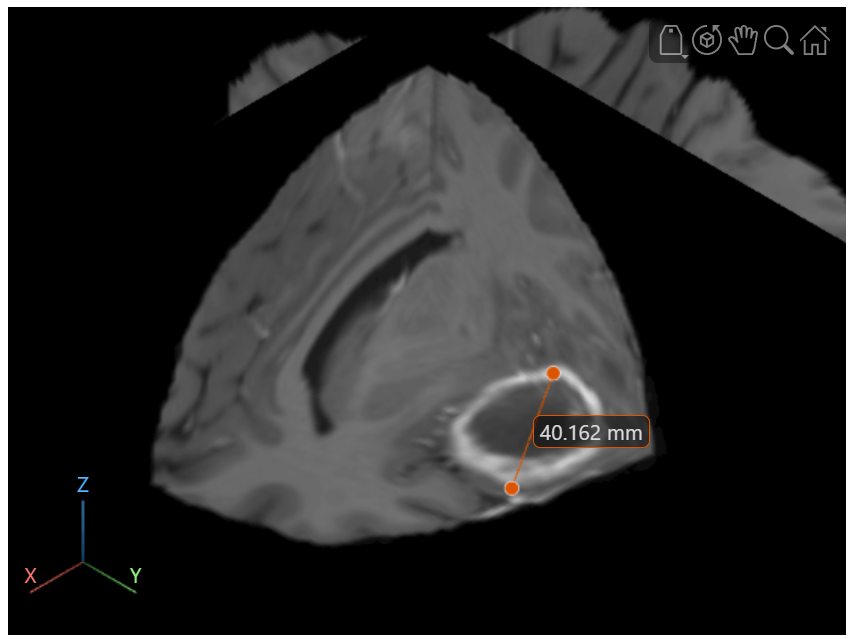
Optionally, to reposition one endpoint, drag the endpoint, not the line or the label. To move the whole line, including both endpoints, hold Ctrl and drag one of the endpoints.
References
[1] Medical Segmentation Decathlon. "Brain Tumours." Tasks. Accessed May 10, 2018. http://medicaldecathlon.com/. The BraTS data set is provided by Medical Segmentation Decathlon under the CC-BY-SA 4.0 license. All warranties and representations are disclaimed. See the license for details. MathWorks® has modified the subset of data used in this example. This example uses the MRI data of one scan from the original data set, saved to a MAT file.
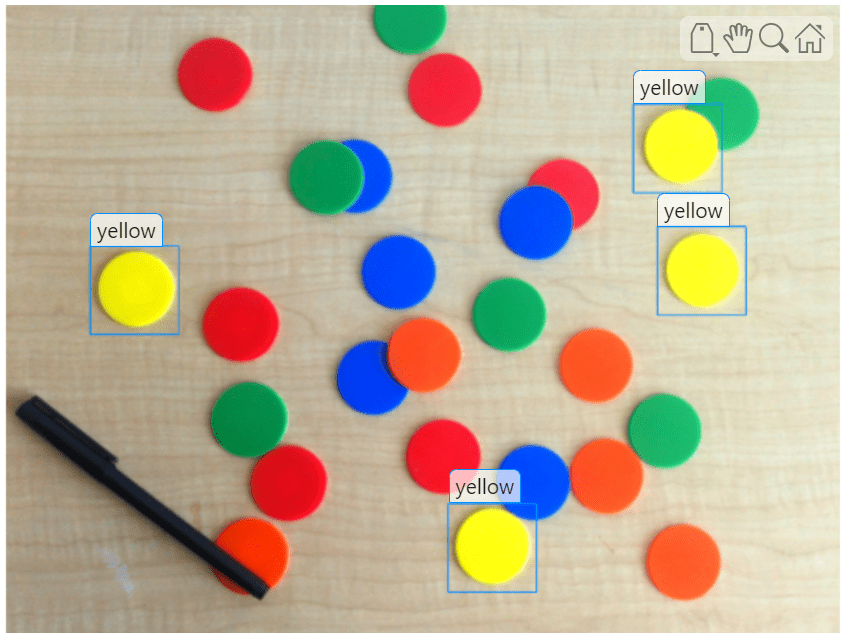
Display an image of colored, circular chips and display rectangles around the yellow chips.
Define positions for rectangles around the yellow chips. Each row defines the [x, y, width, height] for a rectangle.
chipPositions = [53 150 55 55;
                 275 310 55 55;
                 390 62 55 55;
                 405 138 55 55];
Create a viewer and display an image in it. Then, programmatically add the rectangles to the viewer. When you specify the Positions argument, the function skips interactive drawing and displays the specified ROIs. To display the ROIs as static objects, specify the Interactions name-value argument as "none". Disabling interactions can improve rendering speed, especially when you display many objects in a viewer. For example, use this approach to display hundreds of bounding boxes returned by an object detection algorithm.
viewer = viewer2d;
imageshow("coloredChips.png",Parent=viewer);

rois = uidraw(viewer, "rectangle", ...
    Position=chipPositions, ...
    Label="yellow", ...
    Interactions="none");
Input Arguments
Name-Value Arguments
Specify optional pairs of arguments as
Name1=Value1,...,NameN=ValueN, where Name is
the argument name and Value is the corresponding value.
Name-value arguments must appear after other arguments, but the order of the
pairs does not matter.
Example: uidraw(viewer,"circle",Color="red") creates a red
Circle object.
ROI color, specified as an RGB triplet, a hexadecimal color code, a color name, or
a short color name. If you specify multiple ROIs by using the
Position argument, you can specify one color to apply to all of
the ROIs, or separate colors for each ROI. Specify colors for m
ROIs as an m-by-3 array of RGB triplets or as an
m-element string array containing hexadecimal color codes or
color names.
Here are the default ROI colors used in 2-D and 3-D Viewer
objects.
| RGB Triplet | Appearance | When Used |
|---|---|---|
[0 0.5610 1] |
| This is the default color when drawing an ROI in a 2-D
Viewer. |
[0.8660 0.3290 0] |
| This is the default color when drawing an ROI in a 3-D
Viewer. |
For a custom color, specify an RGB triplet or a hexadecimal color code.
An RGB triplet is a three-element row vector whose elements specify the intensities of the red, green, and blue components of the color. The intensities must be in the range
[0,1], for example,[0.4 0.6 0.7].A hexadecimal color code is a string scalar or character vector that starts with a hash symbol (
#) followed by three or six hexadecimal digits, which can range from0toF. The values are not case sensitive. Therefore, the color codes"#FF8800","#ff8800","#F80", and"#f80"are equivalent.
Alternatively, you can specify some common colors by name. This table lists the named color options, the equivalent RGB triplets, and the hexadecimal color codes.
| Color Name | Short Name | RGB Triplet | Hexadecimal Color Code | Appearance |
|---|---|---|---|---|
"red" | "r" | [1 0 0] | "#FF0000" |
|
"green" | "g" | [0 1 0] | "#00FF00" |
|
"blue" | "b" | [0 0 1] | "#0000FF" |
|
"cyan"
| "c" | [0 1 1] | "#00FFFF" |
|
"magenta" | "m" | [1 0 1] | "#FF00FF" |
|
"yellow" | "y" | [1 1 0] | "#FFFF00" |
|
"black" | "k" | [0 0 0] | "#000000" |
|
"white" | "w" | [1 1 1] | "#FFFFFF" |
|
This table lists the default color palettes for plots in the light and dark themes.
| Palette | Palette Colors |
|---|---|
Before R2025a: Most plots use these colors by default. |
|
|
|
You can get the RGB triplets and hexadecimal color codes for these palettes using
the orderedcolors and rgb2hex
functions. For example, this code gets the RGB triplets for the
"gem" palette and converts them to hexadecimal color
codes.
RGB = orderedcolors("gem");
H = rgb2hex(RGB);
Example: Color="r"
Example: Color=["green" "red" "blue"]
Example: Color=[0 0.4470 0.7410]
Display a crosshair while you draw, specified as
When this value is "on", the viewer displays a crosshair that
can help guide you as you draw. When this value is "off", the
crosshair is hidden.
Label for the ROI, specified as a string scalar, character vector, or string
array. By default, the viewer displays a unitless measurement that depends on the
specified shape, as outlined in the table. If the viewer has a nondefault value for
the SpatialUnits property, such as "mm", the
label includes the specified units.
To display a custom label, specify a string scalar or character vector. To display
no label, specify "".
If you specify multiple ROIs by using the Position argument,
you can specify a string scalar to label all of the ROIs, or a string array that
contains one label per ROI.
Data Types: char | string
Position for the ROI, specified as a numeric vector, numeric matrix, or cell
array. When you specify Position, the function skips interactive
drawing and creates the ROI programmatically. You can use the
Position argument to specify multiple ROI annotations of the
same shape.
You can specify the position using one of the formats listed in this table. When
specifying the position of multiple ROIs, m is the
number of ROIs. Values that omit z place the ROI in the default 2-D
image plane, with z equal to 1.
| Shape | Format of Position (Single ROI) | Format of Position (Multiple ROIs) |
|---|---|---|
"line" |
|
|
"point" |
|
|
"polygon" |
|
|
"rectangle" |
Rectangles always lie in the xy-plane, with
z equal to |
|
"circle" |
|
|
"angle" |
|
|
"freehand" |
|
|
"polyline" |
|
|
"ellipse" |
|
|
Data Types: single | double | int8 | int16 | int32 | int64 | uint8 | uint16 | uint32 | uint64 | logical | cell
Behavior for blocking the command line during drawing, specified as one of the values in the table.
| Value | Description |
|---|---|
"drawing" | Block the command line during only drawing. The function resumes and returns the output object when you finish drawing. |
"accept" | Block the command line until you accept the ROI by pressing
Enter or selecting the accept icon |
"multiple" | Block the command line until you accept one or more ROIs by pressing
Enter or selecting the accept icon |
"none" | Do not block the command line. The function returns an empty array of
ROI objects. This option can be useful in custom apps when you want more
flexible control. In this case, use listeners for the
AnnotationAdded and AnnotationMoved events
of the parent Viewer object to detect when annotations are
added or edited. |
Data Types: char | string
Output Arguments
Version History
Introduced in R2026a