Understanding Interest-Rate Tree Models
Introduction
Financial Instruments Toolbox™ supports the following interest-rate trees:
Black-Derman-Toy (BDT)
Black-Karasinski (BK)
Heath-Jarrow-Morton (HJM)
Hull-White (HW)
Cox-Ingersoll-Ross (CIR)
The Heath-Jarrow-Morton model is one of the most widely used models for pricing interest-rate derivatives. The model considers a given initial term structure of interest rates and a specification of the volatility of forward rates to build a tree representing the evolution of the interest rates, based on a statistical process. For further explanation, see the book Modelling Fixed Income Securities and Interest Rate Options by Robert A. Jarrow.
The Black-Derman-Toy model is another analytical model commonly used for pricing interest-rate derivatives. The model considers a given initial zero rate term structure of interest rates and a specification of the yield volatilities of long rates to build a tree representing the evolution of the interest rates. For further explanation, see the paper “A One Factor Model of Interest Rates and its Application to Treasury Bond Options” by Fischer Black, Emanuel Derman, and William Toy.
The Hull-White model incorporates the initial term structure of interest rates and the volatility term structure to build a trinomial recombining tree of short rates. The resulting tree is used to value interest rate-dependent securities. The implementation of the Hull-White model in Financial Instruments Toolbox software is limited to one factor.
The Black-Karasinski model is a single factor, log-normal version of the Hull-White model.
For further information on the Hull-White and Black-Karasinski models, see the book Options, Futures, and Other Derivatives by John C. Hull.
Building a Tree of Forward Rates
The tree of forward rates is the fundamental unit representing the evolution of interest rates in a given period of time. This section explains how to create a forward-rate tree using Financial Instruments Toolbox.
Note
To avoid needless repetition, this document uses the HJM and BDT models to illustrate the creation and use of interest-rate trees. The HW and BK models are similar to the BDT model. Where specific differences exist, they are documented in Examining Trees.
The MATLAB® functions that create rate trees are hjmtree and bdttree. The hjmtree function creates the
structure, HJMTree, containing time and forward-rate information
for a bushy tree. The bdttree function creates a
similar structure, BDTTree, for a recombining tree.
This structure is a self-contained unit that includes the tree of rates (found in
the FwdTree field of the structure) and the volatility, rate, and
time specifications used in building this tree.
These functions take three structures as input arguments:
The volatility model
VolSpec. (See Specifying the Volatility Model (VolSpec).)The interest-rate term structure
RateSpec. (See Specifying the Interest-Rate Term Structure (RateSpec).)The tree time layout
TimeSpec. (See Specifying the Time Structure (TimeSpec).)
An easy way to visualize any trees you create is with the treeviewer function, which
displays trees in a graphical manner. See Graphical Representation of Trees for information
about treeviewer.
Calling Sequence
The calling syntax for hjmtree is HJMTree =
hjmtree(VolSpec, RateSpec, TimeSpec).
Similarly, the calling syntax for bdttree is BDTTree =
bdttree(VolSpec, RateSpec, TimeSpec).
Each of these functions requires VolSpec,
RateSpec, and TimeSpec input
arguments:
VolSpecis a structure that specifies the forward-rate volatility process. You createVolSpecusing either of the functionshjmvolspecorbdtvolspec.The
hjmvolspecfunction supports the specification of up to three factors. It handles these models for the volatility of the interest-rate term structure:Constant
Stationary
Exponential
Vasicek
Proportional
A one-factor model assumes that the interest term structure is affected by a single source of uncertainty. Incorporating multiple factors allows you to specify different types of shifts in the shape and location of the interest-rate structure. See
hjmvolspecfor details.The
bdtvolspecfunction supports only a single volatility factor. The volatility remains constant between pairs of nodes on the tree. You supply the input volatility values in a vector of decimal values. Seebdtvolspecfor details.RateSpecis the interest-rate specification of the initial rate curve. You create this structure with the functionintenvset. (See Modeling the Interest-Rate Term Structure.)TimeSpecis the tree time layout specification. You create this variable with the functionshjmtimespecorbdttimespec. It represents the mapping between level times and level dates for rate quoting. This structure indirectly determines the number of levels in the tree.
Specifying the Volatility Model (VolSpec)
Because HJM supports multifactor (up to 3) volatility models while BDT (also, BK
and HW) supports only a single volatility factor, the hjmvolspec and bdtvolspec functions require
different inputs and generate slightly different outputs. For examples, see Creating an HJM Volatility Model. For BDT
examples, see Creating a BDT Volatility Model.
Creating an HJM Volatility Model
The function hjmvolspec generates the
structure VolSpec, which specifies the volatility process used in the creation of the forward-rate trees. In this
context capital T represents the starting time of the forward
rate, and t represents the observation time. The volatility
process can be constructed from a combination of factors specified sequentially
in the call to function that creates it. Each factor specification starts with a
character vector specifying the name of the factor, followed by the pertinent
parameters.
HJM Volatility Specification
This example shows how to create an HJM volatility specification using hjmvolspec.
Consider an example that uses a single factor, specifically, a constant-sigma factor. The constant factor specification requires only one parameter, the value of . In this case, the value corresponds to 0.10.
HJMVolSpec = hjmvolspec('Constant', 0.10)HJMVolSpec = struct with fields:
FinObj: 'HJMVolSpec'
FactorModels: {'Constant'}
FactorArgs: {{1×1 cell}}
SigmaShift: 0
NumFactors: 1
NumBranch: 2
PBranch: [0.5000 0.5000]
Fact2Branch: [-1 1]
The NumFactors field of the VolSpec structure, VolSpec.NumFactors = 1, reveals that the number of factors used to generate VolSpec was one. The FactorModels field indicates that it is a Constant factor, and the NumBranches field indicates the number of branches. As a consequence, each node of the resulting tree has two branches, one going up, and the other going down.
Consider now a two-factor volatility process made from a proportional factor and an exponential factor.
% Exponential factor
Sigma_0 = 0.1;
Lambda = 1;
% Proportional factor
CurveProp = [0.11765; 0.08825; 0.06865];
CurveTerm = [   1   ;    2   ;    3   ];
% Build VolSpec
HJMVolSpec = hjmvolspec('Proportional', CurveProp, CurveTerm, ...
1e6,'Exponential', Sigma_0, Lambda)
HJMVolSpec = struct with fields:
          FinObj: 'HJMVolSpec'
    FactorModels: {'Proportional'  'Exponential'}
      FactorArgs: {{1×3 cell}  {1×2 cell}}
      SigmaShift: 0
      NumFactors: 2
       NumBranch: 3
         PBranch: [0.2500 0.2500 0.5000]
     Fact2Branch: [2×3 double]
The output shows that the volatility specification was generated using two factors. The tree has three branches per node. Each branch has probabilities of 0.25, 0.25, and 0.5, going from top to bottom.
Creating a BDT Volatility Model
The function bdtvolspec generates the
structure VolSpec, which specifies the volatility process.
The function requires three input arguments:
The valuation date
ValuationDateThe yield volatility end dates
VolDatesThe yield volatility values
VolCurve
An optional fourth argument InterpMethod, specifying the
interpolation method, can be included.
The syntax used for calling bdtvolspec is:
BDTVolSpec = bdtvolspec(ValuationDate, VolDates, VolCurve,...
                        InterpMethod)
where:
ValuationDateis the first observation date in the tree.VolDatesis a vector of dates representing yield volatility end dates.VolCurveis a vector of yield volatility values.InterpMethodis the method of interpolation to use. The default islinear.
BDT Volatility Specification
This example shows how to create an BDT volatility specification using bdtvolspec.
Consider the following code:
ValuationDate = datetime(2000,1,1);
EndDates = [datetime(2001,1,1) ; datetime(2002,1,1) ; datetime(2003,1,1) ;datetime(2004,1,1) ; datetime(2005,1,1)];
Volatility = [.2; .19; .18; .17; .16];
Use bdtvolspec to create a volatility specification. Because no interpolation method is explicitly specified, the function uses the linear default.
BDTVolSpec = bdtvolspec(ValuationDate, EndDates, Volatility)
BDTVolSpec = struct with fields:
             FinObj: 'BDTVolSpec'
      ValuationDate: 730486
           VolDates: [5×1 double]
           VolCurve: [5×1 double]
    VolInterpMethod: 'linear'
Specifying the Interest-Rate Term Structure (RateSpec)
The structure RateSpec is an interest term structure that
defines the initial forward-rate specification from which the tree rates are
derived. Modeling the Interest-Rate Term Structure explains how to
create these structures using the function intenvset, given the interest
rates, the starting and ending dates for each rate, and the compounding
value.
Rate Specification Creation Example
Consider the following example:
Compounding = 1;
Rates = [0.02; 0.02; 0.02; 0.02];
StartDates = ['01-Jan-2000';
              '01-Jan-2001';
              '01-Jan-2002';
              '01-Jan-2003'];
EndDates =   ['01-Jan-2001';
              '01-Jan-2002';
              '01-Jan-2003';
              '01-Jan-2004'];
ValuationDate = '01-Jan-2000';

RateSpec = intenvset('Compounding',1,'Rates', Rates,...
'StartDates', StartDates, 'EndDates', EndDates,...
'ValuationDate', ValuationDate)
RateSpec =

        FinObj: 'RateSpec'
   Compounding: 1
          Disc: [4x1 double]
         Rates: [4x1 double]
      EndTimes: [4x1 double]
    StartTimes: [4x1 double]
      EndDates: [4x1 double]
    StartDates: [4x1 double]
 ValuationDate: 730486
         Basis: 0
  EndMonthRule: 1
Use the function datedisp to examine the dates
defined in the variable RateSpec. For example:
datedisp(RateSpec.ValuationDate)
01-Jan-2000
Specifying the Time Structure (TimeSpec)
The structure TimeSpec specifies the time structure for an
interest-rate tree. This structure defines the mapping between the observation times
at each level of the tree and the corresponding dates.
TimeSpec is built using either the hjmtimespec or bdttimespec function. These
functions require three input arguments:
The valuation date
ValuationDateThe maturity date
MaturityThe compounding rate
Compounding
For example, the syntax used for calling hjmtimespec is
TimeSpec = hjmtimespec(ValuationDate, Maturity,
                Compounding)
where:
ValuationDateis the first observation date in the tree.Maturityis a vector of dates representing the cash flow dates of the tree. Any instrument cash flows with these maturities fall on tree nodes.Compoundingis the frequency at which the rates are compounded when annualized.
Creating a Time Specification
Calling the time specification creation functions with the same data used to
create the interest-rate term structure, RateSpec builds the structure that specifies the
time layout for the tree.
HJM Time Specification Example. Consider the following example:
Maturity = EndDates;
HJMTimeSpec = hjmtimespec(ValuationDate, Maturity, Compounding)
HJMTimeSpec =

       FinObj: 'HJMTimeSpec'
ValuationDate: 730486
     Maturity: [4x1 double]
  Compounding: 1
        Basis: 0
 EndMonthRule: 1
Maturities specified when building TimeSpec need not
coincide with the EndDates of the rate intervals in
RateSpec. Since TimeSpec defines
the time-date mapping of the tree, the rates in RateSpec
are interpolated to obtain the initial rates with maturities equal to those
in TimeSpec.
Creating a BDT Time Specification. Consider the following example:
Maturity = EndDates;
BDTTimeSpec = bdttimespec(ValuationDate, Maturity, Compounding)
BDTTimeSpec =

           FinObj: 'BDTTimeSpec'
    ValuationDate: 730486
         Maturity: [4x1 double]
      Compounding: 1
            Basis: 0
     EndMonthRule: 1
Creating Trees
Use the VolSpec, RateSpec, and
TimeSpec you have previously created as inputs to the
functions used to create HJM and BDT trees.
Creating an HJM Tree
% Reset the volatility factor to the Constant case
HJMVolSpec = hjmvolspec('Constant', 0.10);

HJMTree = hjmtree(HJMVolSpec, RateSpec, HJMTimeSpec)
HJMTree =

  FinObj: 'HJMFwdTree'
 VolSpec: [1x1 struct]
TimeSpec: [1x1 struct]
RateSpec: [1x1 struct]
    tObs: [0 1 2 3]
    TFwd: {[4x1 double] [3x1 double] [2x1 double] [3]}
  CFlowT: {[4x1 double] [3x1 double] [2x1 double] [4]}
 FwdTree:{[4x1 double][3x1x2 double][2x2x2 double][1x4x2 double]}
Creating a BDT Tree
Now use the previously computed values for VolSpec,
RateSpec, and TimeSpec as input to the
function bdttree to create a BDT
tree.
BDTTree = bdttree(BDTVolSpec, RateSpec, BDTTimeSpec)
BDTTree =

  FinObj: 'BDTFwdTree'
 VolSpec: [1x1 struct]
TimeSpec: [1x1 struct]
RateSpec: [1x1 struct]
    tObs: [0 1.00 2.00 3.00]
    TFwd: {[4x1 double]  [3x1 double]  [2x1 double]  [3.00]}
  CFlowT: {[4x1 double]  [3x1 double]  [2x1 double]  [4.00]}
 FwdTree: {[1.02] [1.02 1.02] [1.01 1.02 1.03] [1.01 1.02 1.02 1.03]}
Examining Trees
This example shows how to work with models that use trees to represent forward rates, prices, and so on. At the highest level, these trees have structures wrapped around them. The structures encapsulate information required to interpret completely the information contained in a tree.
This example uses the interest rate and portfolio data in the MAT-file deriv.mat.
Load Data
Load the deriv.mat file.
load deriv.matDisplay the list of the variables loaded from the MAT-file.
whos
  Name              Size            Bytes  Class     Attributes

  BDTInstSet        1x1             26985  struct
  BDTTree           1x1              5953  struct
  BKInstSet         1x1             26975  struct
  BKTree            1x1              6971  struct
  CIRInstSet        1x1             29227  struct
  CIRTree           1x1              6440  struct
  CRRInstSet        1x1             20707  struct
  CRRTree           1x1              5520  struct
  EQPInstSet        1x1             20707  struct
  EQPTree           1x1              5520  struct
  HJMInstSet        1x1             26977  struct
  HJMTree           1x1              6822  struct
  HWInstSet         1x1             26975  struct
  HWTree            1x1              6971  struct
  ITTInstSet        1x1             20711  struct
  ITTTree           1x1             10775  struct
  STTInstSet        1x1             20711  struct
  STTTree           1x1              6264  struct
  ZeroInstSet       1x1             17099  struct
  ZeroRateSpec      1x1              1644  struct
HJM Tree Structure
You can now examine in some detail the contents of the HJMTree structure contained in the deriv.mat file.
HJMTree
HJMTree = struct with fields:
      FinObj: 'HJMFwdTree'
     VolSpec: [1×1 struct]
    TimeSpec: [1×1 struct]
    RateSpec: [1×1 struct]
        tObs: [0 1 2 3]
        TFwd: {[4×1 double]  [3×1 double]  [2×1 double]  [3]}
      CFlowT: {[4×1 double]  [3×1 double]  [2×1 double]  [4]}
     FwdTree: {[4×1 double]  [3×1×2 double]  [2×2×2 double]  [1×4×2 double]}
FwdTree contains the actual forward-rate tree. MATLAB® represents it as a cell array with each cell array element containing a tree level.
The other fields contain other information relevant to interpreting the values in FwdTree. The most important are VolSpec, TimeSpec, and RateSpec, which contain the volatility, time structure, and rate structure information respectively.
First Tree Node
Observe the forward rates in FwdTree. The first node represents the valuation date, tObs = 0.
HJMTree.FwdTree{1}ans = 4×1
1.0356
1.0468
1.0523
1.0563
Note that Financial Instruments Toolbox™ uses inverse discount notation for forward rates in the tree. An inverse discount represents a factor by which the current value of an asset is multiplied to find its future value. In general, these forward factors are reciprocals of the discount factors.
Look closely at the RateSpec structure used in generating this tree to see where these values originate. Arrange the values in a single array.
[HJMTree.RateSpec.StartTimes HJMTree.RateSpec.EndTimes...
HJMTree.RateSpec.Rates]
ans = 4×3

         0    1.0000    0.0356
    1.0000    2.0000    0.0468
    2.0000    3.0000    0.0523
    3.0000    4.0000    0.0563
If you find the corresponding inverse discounts of the interest rates in the third column, you have the values at the first node of the tree. You can turn interest rates into inverse discounts using the function rate2disc.
Second Tree Node
The second node represents the first-rate observation time, tObs = 1. This node displays two states: one representing the branch going up and the other representing the branch going down. Note that HJMTree.VolSpec.NumBranch = 2.
HJMTree.VolSpec
ans = struct with fields:
          FinObj: 'HJMVolSpec'
    FactorModels: {'Constant'}
      FactorArgs: {{1×1 cell}}
      SigmaShift: 0
      NumFactors: 1
       NumBranch: 2
         PBranch: [0.5000 0.5000]
     Fact2Branch: [-1 1]
Examine the rates of the node corresponding to the up branch.
HJMTree.FwdTree{2}(:,:,1)ans = 3×1
1.0364
1.0420
1.0461
Examine the corresponding down branch.
HJMTree.FwdTree{2}(:,:,2)ans = 3×1
1.0574
1.0631
1.0672
Third Tree Node
The third node represents the second observation time, tObs = 2. This node contains a total of four states, two representing the branches going up and the other two representing the branches going down. Examine the rates of the node corresponding to the up states.
HJMTree.FwdTree{3}(:,:,1)ans = 2×2
1.0317 1.0526
1.0358 1.0568
Examine the corresponding down states.
HJMTree.FwdTree{3}(:,:,2)ans = 2×2
1.0526 1.0738
1.0568 1.0781
Isolating a Specific HJMTree Node
Starting at the third level, indexing within the tree cell array becomes complex, and isolating a specific node can be difficult. The function bushpath isolates a specific node by specifying the path to the node as a vector of branches taken to reach that node. As an example, consider the node reached by starting from the root node, taking the branch up, then the branch down, and then another branch down. Given that the tree has only two branches per node, branches going up correspond to a 1, and branches going down correspond to a 2. The path up-down-down becomes the vector [1 2 2].
FRates = bushpath(HJMTree.FwdTree, [1 2 2])
FRates = 4×1

    1.0356
    1.0364
    1.0526
    1.0674
bushpath returns the spot rates for all the nodes tapped by the path specified in the input argument, the first one corresponding to the root node, and the last one corresponding to the target node.
Isolating the same node using direct indexing obtains:
HJMTree.FwdTree{4}(:, 3, 2)ans = 1.0674
As expected, this single value corresponds to the last element of the rates returned by bushpath. You can use these techniques with any type of tree generated with Financial Instruments Toolbox™ such as forward-rate trees or price trees.
BDT Tree Structure
You can now examine in some detail the contents of the BDTTree structure.
BDTTree
BDTTree = struct with fields:
      FinObj: 'BDTFwdTree'
     VolSpec: [1×1 struct]
    TimeSpec: [1×1 struct]
    RateSpec: [1×1 struct]
        tObs: [0 1 2 3]
        TFwd: {[4×1 double]  [3×1 double]  [2×1 double]  [3]}
      CFlowT: {[4×1 double]  [3×1 double]  [2×1 double]  [4]}
     FwdTree: {[1.1000]  [1.0979 1.1432]  [1.0976 1.1377 1.1942]  [1.0872 1.1183 1.1606 1.2179]}
FwdTree contains the actual rate tree. MATLAB® represents it as a cell array with each cell array element containing a tree level.
The other fields contain other information relevant to interpreting the values in FwdTree. The most important are VolSpec, TimeSpec, and RateSpec, which contain the volatility, time structure, and rate structure information respectively.
Look at the RateSpec structure used in generating this tree to see where these values originate. Arrange the values in a single array.
[BDTTree.RateSpec.StartTimes BDTTree.RateSpec.EndTimes...
BDTTree.RateSpec.Rates]
ans = 4×3

         0    1.0000    0.1000
         0    2.0000    0.1100
         0    3.0000    0.1200
         0    4.0000    0.1250
Look at the rates in FwdTree. The first node represents the valuation date, tObs = 0. The second node represents tObs = 1. Examine the rates at the second, third, and fourth nodes.
BDTTree.FwdTree{2}ans = 1×2
1.0979 1.1432
The second node represents the first observation time, tObs = 1. This node contains a total of two states, one representing the branch going up (1.0979) and the other representing the branch going down (1.1432).
The convention is to display prices going up on the upper branch. So, when displaying rates, rates are falling on the upper branch and increasing on the lower branch.
BDTTree.FwdTree{3}ans = 1×3
1.0976 1.1377 1.1942
The third node represents the second observation time, tObs = 2. This node contains a total of three states, one representing the branch going up (1.0976), one representing the branch in the middle (1.1377) and the other representing the branch going down (1.1942).
BDTTree.FwdTree{4}ans = 1×4
1.0872 1.1183 1.1606 1.2179
The fourth node represents the third observation time, tObs = 3. This node contains a total of four states, one representing the branch going up (1.0872), two representing the branches in the middle (1.1183 and 1.1606), and the other representing the branch going down (1.2179).
Isolating a Specific BDTTree Node
The function treepath isolates a specific node by specifying the path to the node as a vector of branches taken to reach that node. As an example, consider the node reached by starting from the root node, taking the branch up, then the branch down, and finally another branch down. Given that the tree has only two branches per node, branches going up correspond to a 1, and branches going down correspond to a 2. The path up-down-down becomes the vector [1 2 2].
FRates = treepath(BDTTree.FwdTree, [1 2 2])
FRates = 4×1

    1.1000
    1.0979
    1.1377
    1.1606
treepath returns the short rates for all the nodes tapped by the path specified in the input argument, the first one corresponding to the root node, and the last one corresponding to the target node.
HW and BK Tree Structures
The HW and BK tree structures are similar to the BDT tree structure. You can see this if you examine the sample HW tree contained in the file deriv.mat.
HWTree
HWTree = struct with fields:
      FinObj: 'HWFwdTree'
     VolSpec: [1×1 struct]
    TimeSpec: [1×1 struct]
    RateSpec: [1×1 struct]
        tObs: [0 1 2 3]
        dObs: [731947 732313 732678 733043]
      CFlowT: {[4×1 double]  [3×1 double]  [2×1 double]  [4]}
       Probs: {[3×1 double]  [3×3 double]  [3×5 double]}
     Connect: {[2]  [2 3 4]  [2 2 3 4 4]}
     FwdTree: {[1.0279]  [1.0528 1.0356 1.0186]  [1.0829 1.0652 1.0478 1.0306 1.0138]  [1.0946 1.0767 1.0591 1.0418 1.0248]}
All fields of this structure are similar to their BDT counterparts. There are two additional fields not present in BDT: Probs and Connect. The Probs field represents the occurrence probabilities at each branch of each node in the tree. The Connect field describes the connectivity of the nodes of a given tree level to nodes to the next tree level.
Probs Field
While BDT and one-factor HJM models have equal probabilities for each branch at a node, HW and BK do not. For HW and BK trees, the Probs field indicates the likelihood that a particular branch will be taken in moving from one node to another node on the next level.
The Probs field consists of a cell array with one cell per tree level. Each cell is a 3-by-NUMNODES array with the top row representing the probability of an up movement, the middle row representing the probability of a middle movement, and the last row the probability of a down movement.
As an illustration, consider the first two elements of the Probs field of the structure, corresponding to the first (root) and second levels of the tree.
HWTree.Probs{1}ans = 3×1
0.1667
0.6667
0.1667
HWTree.Probs{2}ans = 3×3
0.1236 0.1667 0.2188
0.6576 0.6667 0.6576
0.2188 0.1667 0.1236
Reading from top to bottom, the values in HWTree.Probs{1} correspond to the up, middle, and down probabilities at the root node.
HWTree.Probs{2} is a 3-by-3 matrix of values. The first column represents the top node, the second column represents the middle node, and the last column represents the bottom node. As with the root node, the first, second, and third rows hold the values for up, middle, and down branching off each node.
The sum of all the probabilities at any node equals 1.
sum(HWTree.Probs{2})ans = 1×3
1.0000 1.0000 1.0000
Connect Field
The other field that distinguishes HW and BK tree structures from the BDT tree structure is Connect. This field describes how each node in a given level connects to the nodes of the next level. The need for this field arises from the possibility of nonstandard branching in a tree.
The Connect field of the HW tree structure consists of a cell array with one cell per tree level.
HWTree.Connect
ans=1×3 cell array
    {[2]}    {[2 3 4]}    {[2 2 3 4 4]}
Each cell contains a 1-by-NUMNODES vector. Each value in the vector relates to a node in the corresponding tree level and represents the index of the node in the next tree level that the middle branch of the node connects to.
If you subtract 1 from the values contained in Connect, you reveal the index of the nodes in the next level that the up branch connects to. If you add 1 to the values, you reveal the index of the corresponding down branch.
As an illustration, consider HWTree.Connect{1}:
HWTree.Connect{1}ans = 2
This indicates that the middle branch of the root node connects to the second (from the top) node of the next level, as expected. If you subtract 1 from this value, you obtain 1, which tells you that the up branch goes to the top node. If you add 1, you obtain 3, which points to the last node of the second level of the tree.
Consider level 3 in this example:
HWTree.Connect{3}ans = 1×5
2 2 3 4 4
On this level, there is nonstandard branching. This can be easily recognized because the middle branch of two nodes is connected to the same node on the next level.
To visualize this, consider the following illustration of the tree.
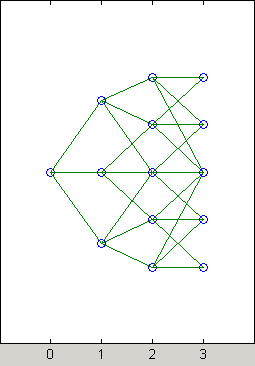
Here it becomes apparent that there is nonstandard branching at the third level of the tree, on the top and bottom nodes. The first and second nodes connect to the same trio of nodes on the next level. Similar branching occurs at the bottom and next-to-bottom nodes of the tree.
See Also
instbond | instcap | instcf | instfixed | instfloat | instfloor | instoptbnd | instoptembnd | instoptfloat | instoptemfloat | instrangefloat | instswap | instswaption | intenvset | bondbyzero | cfbyzero | fixedbyzero | floatbyzero | intenvprice | intenvsens | swapbyzero | floatmargin | floatdiscmargin | hjmtimespec | hjmtree | hjmvolspec | bondbyhjm | capbyhjm | cfbyhjm | fixedbyhjm | floatbyhjm | floorbyhjm | hjmprice | hjmsens | mmktbyhjm | oasbyhjm | optbndbyhjm | optfloatbyhjm | optembndbyhjm | optemfloatbyhjm | rangefloatbyhjm | swapbyhjm | swaptionbyhjm | bdttimespec | bdttree | bdtvolspec | bdtprice | bdtsens | bondbybdt | capbybdt | cfbybdt | fixedbybdt | floatbybdt | floorbybdt | mmktbybdt | oasbybdt | optbndbybdt | optfloatbybdt | optembndbybdt | optemfloatbybdt | rangefloatbybdt | swapbybdt | swaptionbybdt | hwtimespec | hwtree | hwvolspec | bondbyhw | capbyhw | cfbyhw | fixedbyhw | floatbyhw | floorbyhw | hwcalbycap | hwcalbyfloor | hwprice | hwsens | oasbyhw | optbndbyhw | optfloatbyhw | optembndbyhw | optemfloatbyhw | rangefloatbyhw | swapbyhw | swaptionbyhw | bktimespec | bktree | bkvolspec | bkprice | bksens | bondbybk | capbybk | cfbybk | fixedbybk | floatbybk | floorbybk | oasbybk | optbndbybk | optfloatbybk | optembndbybk | optemfloatbybk | rangefloatbybk | swapbybk | swaptionbybk | capbyblk | floorbyblk | swaptionbyblk
Topics
- Overview of Interest-Rate Tree Models
- Pricing Using Interest-Rate Term Structure
- Pricing Using Interest-Rate Tree Models
- Graphical Representation of Trees
- Use treeviewer to Examine HWTree and PriceTree When Pricing European Callable Bond
- Supported Interest-Rate Instrument Functions
- Supported Equity Derivative Functions
- Supported Energy Derivative Functions
- Mapping Financial Instruments Toolbox Functions for Interest-Rate Instrument Objects